









back to blog

Supply chain risk management for electronics: a complete guide

Supply chain risk management for electronics: a complete guide

Industry

Exploded view of a circuit board above its chip and substrate, with the silicon wafer beneath split in two, illustrating supply chain risk management for electronics

A single line on a bill of materials (BOM) can fail because of a late product change notification, a packaging bottleneck, or a supplier disruption. Your team needs to know the impact and who acts next.

Supply chain risk management (SCRM) for electronics is the capability to understand where the electronics supply chain can fail, how severely it would impact operations, what can be done about it, and how quickly an organization can detect and respond when conditions change.

That definition borrows the systematic-process structure of NIST’s supply chain guidance, written for cybersecurity but transferable, and applies it to electronics supply risk. It also reflects a practical electronics problem: component availability, tariffs, export controls, and product changes now move faster than annual planning cycles.

Electronics SCRM at a glance

Electronics supply chains are more fragile than most industrial ones. They combine extreme specialization, deep multi-tier opacity, fast component obsolescence, and a few hard bottlenecks at the wafer, advanced packaging, test, substrate, and critical-material levels.

Three forces sharpen that in 2026:

  • AI infrastructure demand is absorbing a disproportionate share of high-bandwidth memory (HBM), chip-on-wafer-on-substrate (CoWoS)-class packaging, leading-edge logic, and power infrastructure.

  • Export-control and tariff changes move landed cost or legal availability faster than design cycles.

  • Lifecycle events such as product change notifications (PCNs), end-of-life (EOL) notices, package changes, and firmware-toolchain dependencies can turn a “supply issue” into a redesign issue overnight.

📊 Three in four assemblies carry lifecycle risk

In a Luminovo analysis of nearly 38,000 electronic assemblies, 75% had at least one BOM line in which every approved part was not recommended for new designs (NRND), end-of-life, or obsolete.

Source: anonymized Luminovo platform data, September 2026. Customer assemblies with at least 20 BOM lines and known lifecycle status for at least half of their lines, duplicates removed, checked against current lifecycle status.

The four core pillars of SCRM

The guide runs in one order, with continuous improvement throughout.

1. Visibility

Map what each product depends on, from the BOM down to fab, package, and substrate.

2. Scoring

Rank exposure so attention goes to the parts that can stop a line.

3. Governance

Settle who decides what, and by when.

4. Playbooks

Turn each decision into a pre-approved response.

Teams that see only Tier-1 suppliers react late. Teams that can see BOM-to-fab, outsourced semiconductor assembly and test (OSAT), substrate, package, and compliance dependencies can rank exposure early, escalate only the issues that matter, and respond with the right lever: alternate, buffer, last-time buy (LTB), contract, redesign, or reroute. The same pattern runs through traceability work at NIST and IPC’s traceability standard.

This guide is for the people who own continuity: original equipment manufacturer (OEM) supply chain leaders, electronics manufacturing services (EMS) and original design manufacturer (ODM) operations teams, commodity managers, procurement, quality and compliance leads, and the engineers who own alternates, qualifications, and engineering change orders (ECOs). Every recommendation comes with an artifact, metric, or trigger you can use in live operations.

How to use this guide

Start with the taxonomy and watchlist, build minimum viable visibility for the top 25 revenue-critical parts (ranked by supply risk and by how much assembly revenue each part can stop, not by what the part itself costs), deploy the scorecard and escalation triggers, then formalize the four response playbooks. That sequence usually produces faster risk reduction than a big-bang software implementation.

Why supply chain risk management for electronics matters

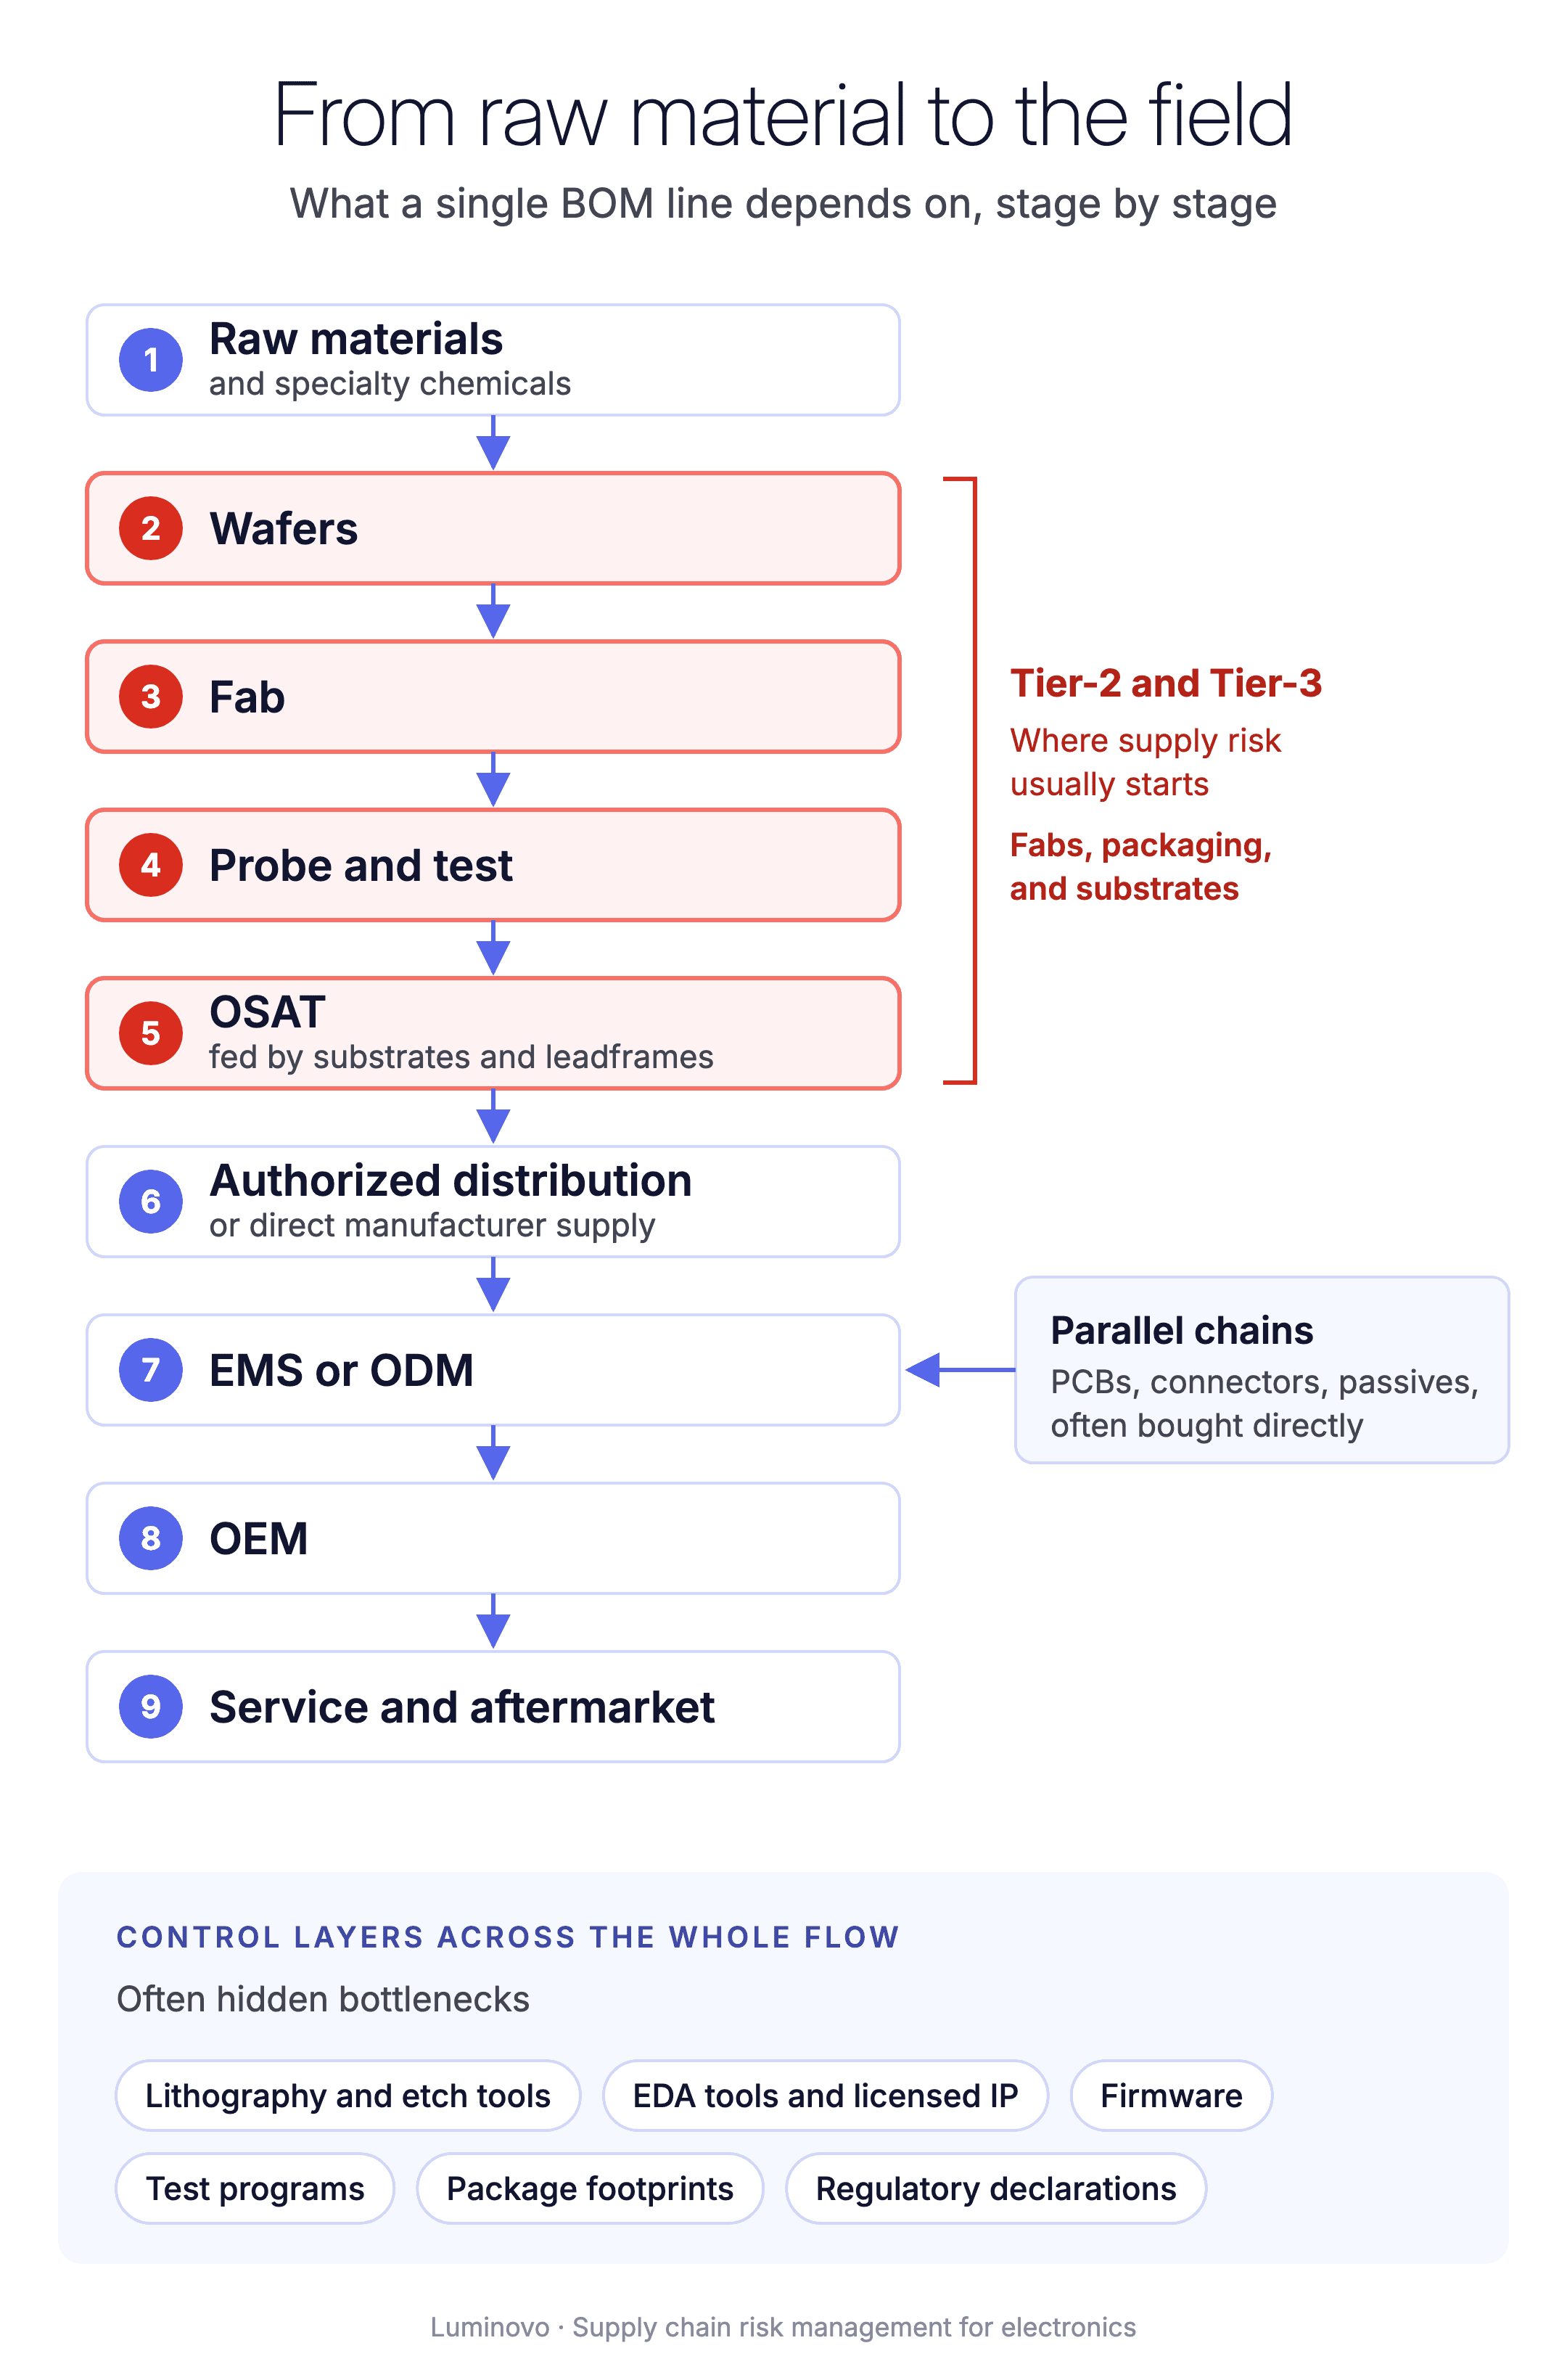
In electronics, a single BOM line can depend on upstream wafer capacity, a specific fab node, a limited-package OSAT line, substrate build-up film, a particular test insert, distributor stock, and an EMS line qualification. The chain runs, from raw material to the field:

  1. Raw materials and specialty chemicals

  2. Wafers

  3. Fab

  4. Probe and test

  5. OSAT, fed by substrates and leadframes

  6. Authorized distribution or direct manufacturer supply

  7. EMS or ODM

  8. OEM

  9. Service and aftermarket

PCBs, connectors, and passives run as parallel supply chains, often bought directly from fabricators and manufacturers. Those dependencies are why supply chain issues in electronics rarely resolve at a single tier.

Across that flow sit control layers that often become hidden bottlenecks: lithography and etch tools, electronic design automation (EDA) tools and licensed IP, firmware, test programs, package footprints, and regulatory declarations.
What makes electronics different from other manufacturing sectors is the qualification burden attached to change. A pin-compatible alternate often stops being a drop-in replacement in practice: small differences in package tolerances, power profile, thermal behavior, oscillator behavior, memory timing, or software support can trigger PCB revision, validation, recertification, or field-service complications. AMD’s documentation on footprint compatibility shows that compatible sourcing is decided at the design stage.

The same is true for lifecycle management. Two JEDEC standards still set the baseline for notice: J-STD-046 for product and process changes, and J-STD-048 for discontinuance, which is announced through a product discontinuance notice (PDN). Compliance is uneven, though, especially among passive, electromechanical, and smaller component makers.

Many component discontinuations now arrive with no formal manufacturer notice, neither a PCN nor a PDN, leaving teams with less structured warning than the standards intend.

Part of the reason notices go missing is structural: formal notices go to the customer of record, and franchised distributors forward them to their buyers, often late or incompletely. An OEM whose parts its EMS buys turnkey, or that buys through brokers, often never sees them unless the EMS relays them. That is why automated lifecycle monitoring must track status changes, NRND flags, distributor stock behavior, and lifecycle forecasts, rather than wait for notices to arrive.

Contractually, the electronics market is also unusual. Long-term agreements (LTAs), non-cancelable, non-returnable (NCNR) provisions, allocation clauses, backlog/commit language, and volume-priority arrangements can decide continuity long before a public shortage is visible.

By December 2025, Micron had agreed price and volume for its entire calendar-2026 HBM supply and was negotiating multiyear contracts with specific commitments. Across DRAM, TrendForce reported buyers competing more aggressively for allocations in early 2026, while suppliers kept moving capacity toward server and HBM products.

In practice, “forecast discipline” has become as much a commercial control mechanism as a planning input.

🔗 Unify your entire EMS supply chain

Connect suppliers, customers, and internal teams in one real-time platform with shared workflows.

👉 Discover the platform

Common supply chain threat taxonomy

The table below maps the canonical risk families to electronics realities, tier exposure, and time horizon.

Risk family

In electronics

Leading signal

First action

Demand risk
0–12 months

AI-driven mix shifts, demand front-loading, channel distortion, sudden hyperscaler pull-ins

Forecast error, booking spike, design activity, distributor depletion

Freeze assumptions on critical BOM lines and segment demand by availability class

Supply risk
Immediate to 18 months

Fab bottlenecks, OSAT choke points, Ajinomoto build-up film (ABF) limits, yield and test constraints

Lead-time slope, allocation flags, wafer/package bookings

Identify shared sub-tier dependencies, qualify alternates, reserve capacity

Geopolitical risk
Immediate to multi-year

Export controls, tariffs, sanctions, industrial-policy intervention, shipping choke points

Legal notices, customs changes, crisis-stage triggers, freight reroutes

Legal review, trade re-costing, geographic dual-path plan

Regulatory and compliance risk
1–18 months

RoHS, REACH, and PFAS rule changes, forced-labor detentions, EU cyber rules, missing declarations

New substance thresholds, detentions, declaration expiries

Compliance refresh on top BOMs, document traceability, supplier attestations

Operational risk
Immediate to six months

Factory outages, cyber incidents, ERP/PLM data breaks, stale approved manufacturer and vendor lists (AML/AVL)

On-time in-full (OTIF) drift, ECO latency, mismatched part records, quality alerts

Data governance, escalation, contingency build plan

Lifecycle risk
One month to five years

PCN/EOL, NRND, missing notices, package migration, toolchain and firmware lock-in

PCN velocity, lifecycle forecast, manufacturer notices

Triage, qualify, LTB or redesign

Authenticity and quality risk
Immediate to 12 months

Counterfeit or broker exposure, unauthorized sourcing, latent defects, quality escapes

Broker share, suspect lots, quality escapes, test failures

Authorized-only sourcing default, screening, quarantine and traceability

Tailored risk register schema

A usable electronics risk register should track more than “supplier” and “lead time.” At minimum, it needs five groups of fields, which reflect today’s real failure modes at the part level:

  • Part identity — internal part number, manufacturer part number (MPN), and package and footprint

  • Supply path — fab and node if known, OSAT or package house, substrate or leadframe dependency, country of origin and ship-from, and authorized vs. broker path

  • Alternates and lifecycle — AML depth, alternate and qualification status, firmware and toolchain dependency, lifecycle status, and PCN or EOL date

  • Commercial exposure — NCNR exposure, tariff and export-control exposure, current lead time, lead-time slope, and revenue at risk

  • Ownership — a named owner for every line

In practice, a part can look “dual-source” at Tier-1 while actually sharing the same hidden OSAT or substrate supplier across two approved manufacturers. That is why paper dual-sourcing often fails under stress. Part-to-site and sub-tier mapping are more useful than supplier-count metrics alone.

Electronics supply chain risk in 2026

The highest-confidence 2026 demand signal is concentration around AI infrastructure. TrendForce reported that Taiwan Semiconductor Manufacturing Company (TSMC) projects AI-accelerator wafer demand to rise elevenfold from 2022 to 2026. It also reported that AI demand had tightened both 3 nm–2 nm wafer capacity and 2.5D/3D advanced packaging, with the CoWoS shortage spilling upstream into production equipment and downstream into substrates, packaging materials, and other critical components.

The spillovers matter as much as the headline GPU story.

Memory was the tightest segment in early 2026, as DRAM suppliers kept moving advanced nodes and new capacity toward server and HBM products. Power parts followed: TrendForce expects power-management IC lead times to stretch from 21–26 weeks to 35–40 weeks. So did high-capacitance multilayer ceramic capacitors (MLCCs), where makers’ book-to-bill ratios hit post-pandemic highs. Market signals in 2026 pointed to memory price growth and renewed MLCC tightness rather than a broad-based shortage.

The 2026 market is strategically tight in a handful of AI-exposed categories, while much of the rest has normalized. A missing part from a normalized category still stops a build, so monitoring can’t stop at the tight ones.

Allocation regimes in 2026

Allocation has shifted from emergency language to a continuing commercial model in some categories, especially memory. The reason is structural and commercial: new capacity takes years to add, memory makers have held back investment since the last downturn, and wafer capacity has shifted to HBM, which consumes far more wafer per bit than standard DRAM.

Allocation is how suppliers ration what remains and also serves as a pricing and customer-prioritization tool.

The practical regimes now seen in the market are: hard allocation with supplier-controlled shipping windows; contracted allocation with tied price/volume commitments; informal preference allocation where supplier behavior favors strategic accounts; and distribution-mediated allocation where inventory exists, but access depends on relationships and a credible backlog.

A workable “customer-of-choice” playbook in this environment comes down to six concrete behaviors:

  • A meaningful and growing share of the supplier’s spend

  • A strong design-win and design-registration position

  • Forecast accuracy

  • Fast NCNR decisions when justified

  • Clean debit and claim behavior

  • Engineering engagement on alternates and roadmap transitions

For EMS providers, allocation on customer-controlled parts often flows through the OEM’s own agreements, so the OEM’s backing for the EMS demand matters as much as the EMS relationship itself.

Those behaviors are the operational substance of supplier relationship management (SRM): risk explains why a supplier base needs to be managed, and SRM is how that management is carried out.

ASCM’s procurement guidance reinforces the same principle: suppliers reserve flexibility for customers who remove planning volatility and commercial friction.

The memory chip shortage shows where this leads: the Korea Herald reported in August 2026 that SK hynix’s chief executive expects it to last through 2030.

The lesson for OEMs is that under persistent allocation, volume, strategic weight, and signed commitments decide each buyer’s share, and a credible forecast is what keeps a smaller buyer’s share from being cut first.

Tariffs, export controls & crisis powers

The most material policy developments for electronics leaders to monitor in 2026 are multinational in scope.

In the United States, tariff policy has moved fast. Tariffs imposed under the International Emergency Economic Powers Act (IEEPA) were terminated in February 2026 by Executive Order 14389, which expressly preserved duties resting on other authorities. Tariffs under Section 301 of the Trade Act of 1974 and Section 232 of the Trade Expansion Act of 1962 remain in place.

Related to artificial intelligence, the January 2026 Section 232 proclamation established a framework to adjust imports of semiconductors, semiconductor manufacturing equipment, and derivative products, including an immediate 25% duty on certain advanced computing chips and derivative products under specified conditions, while signaling possible broader semiconductor tariff actions.

At the same time, the Bureau of Industry and Security (BIS) moved license reviews for certain advanced computing chips exported from the US to China and Macau to case-by-case in a January 2026 rule, and its May 2026 guidance confirmed that exporting advanced computing items to entities headquartered in Country Group D:5 or Macau still requires a license.

In Europe, the Chips Act already contains a crisis-response pillar with monitoring, a semiconductor alert system, the European Semiconductor Board, and the possibility of a “crisis stage”; the Commission also ran a semiconductor supply-disruption simulation with all 27 member states in November 2025.

In June 2026, the Commission published its Chips Act 2.0 proposal, which the European Parliament and member states still have to agree on. Under the existing act, once a crisis stage is activated, the Commission can, as a last resort, require integrated production facilities and open EU foundries to accept and prioritize orders for crisis-relevant products, so European supply is exposed to intervention as well as to subsidies.

China’s controls on gallium, germanium, graphite, tungsten, tellurium, bismuth, molybdenum, indium, and some rare-earth items have made “critical-material exposure” a live electronics risk rather than a mining-sector abstraction. The Netherlands tightened export controls on advanced semiconductor manufacturing equipment, effective April 2025, adding another layer of uncertainty for advanced fabs.

These regimes matter even for mature-node OEMs because they can affect tool service, materials, pricing, and midstream availability, not only frontier AI accelerators.

Government action can also hit a single supplier directly, and the damage lands unevenly across OEMs, EMS providers, and PCB makers. The Nexperia episode is a recent worked example: a Dutch government intervention in the company and a retaliatory Chinese export ban on its China-assembled output cut supply without any material or equipment control involved.

Category heatmap

Category

2026 posture

Why it matters now

Practical response

HBM and server DRAM

Severe

Allocated supply, multiyear commitments, AI crowd-out

Lock contract cover, prioritize uses, pre-qualify alternate densities and modules; HBM comes only via the accelerator vendor

Advanced packaging and CoWoS-class services

Severe

Bottleneck shifted downstream from wafers to packaging

Secure allocation from the accelerator vendor and lock delivery dates; only direct silicon customers can reserve capacity

ABF substrates and packaging materials

High

Packaging expansion pulls substrates and materials

Identify shared substrate exposure, add supplier/site mapping

Power semiconductors and power passives

High

AI data-center build-out raises server and power infrastructure demand

Buffer selectively, secure alternates, split demand by program criticality

High-CV MLCCs

High

AI server content and selective tightness

Pre-qualify alternates, widen spec bands where safe

MCUs and embedded processing

Medium

Normalized versus crisis years, but still exposed to package and tariff shocks

Watch lead-time slope and package-specific scarcity

Analog and standard logic

Medium

Selective tightness, occasional supplier disruptions

Maintain alternates and monitor package constraints

General connectors/interconnects

Medium

Metal-cost and demand pressure more than broad shortage

Hedge long-commit programs, track pricing separately from lead time

The best way to triangulate this heatmap is to require three lenses before changing policy: a statement from the original component manufacturer (OCM) or distributor, an independent market signal, and your own demand and consumption data.

For example, supplier claims of normalization should be checked against ECIA’s Industry Pulse lead-time survey, distributor inventory behavior, and your own commit volatility. That prevents overbuying in a tariff-frontload market and underbuying in a structurally allocated market.

2026 watchlist

Risk theme

Leading indicator

Data source

Trigger

Memory allocation deepens

HBM and DRAM price and allocation-only contract signals

Micron investor relations, TrendForce, Wall Street Journal

Any critical memory line marked allocation-only for two consecutive reviews

Packaging bottleneck migrates upstream

CoWoS queue growth, substrate tightness

TrendForce, TSMC, SEMI

20%+ increase in package lead time or capacity reservation refusals

Tariff repricing shock

New Section 232 scope, broker price jumps

Federal Register, White House, customs broker

BOM re-cost >3% on critical product family

Export-control denial risk

BIS guidance/rule change, license delays

BIS, legal counsel

Any affected item lacks classification and routing rule within five business days

Forced-labor or compliance interruption

Detentions, declaration gaps, supplier slow responses

US Customs and Border Protection (CBP), supplier portal, risk-intelligence feeds

Missing declaration on top-50 revenue parts beyond review deadline

Lifecycle surprise

PCN velocity, EOL without notice

Manufacturer PCN/PDN systems, part-lifecycle data providers, distributor notices

Any top-25 part enters NRND/EOL without qualified alternate

Legacy-node EOL accelerates

EOL notices on mature-node parts arriving ahead of published roadmaps

Manufacturer PCN systems, distributor notices

A top-25 legacy-node part gets an EOL notice with a buy window shorter than your redesign time

Logistics reroute

Suez/Red Sea/Hormuz disruption

Freightos, carriers, forwarders

Transit-time variance >30% on critical lanes

Visibility as the foundation

Supply chain visibility in electronics must be multi-tier, starting at the part level and extending to the site level. Supplier names alone are insufficient because multiple approved sources can collapse into a single hidden fab, OSAT, substrate supplier, or even toolset dependency.

Best practice is to combine three methods, knowing each has limits:

  1. Supplier questionnaires for declared dependencies. Component manufacturers often decline to name fab or assembly sites, or disclose them only under a nondisclosure agreement.

  2. Site-level evidence from PCN site changes, qualification reports, country-of-origin data, and lot or date-code markings.

  3. External graph enrichment from specialist mapping tools and intelligence platforms.

A pragmatic mapping playbook

For most OEMs and EMS firms, the fastest path is a staged mapping program, built out from the parts that matter most:

Step

What to map first

Why

Start with the top 25 revenue-critical parts

Highest revenue-at-risk and line-stop potential

Generates immediate resilience value

Add package and manufacturer site

Package scarcity often breaks alternates

Distinguishes true from paper dual-source

Add fab, OSAT, substrate or leadframe where known

Reveals shared chokepoints

Exposes hidden concentration

Add compliance and origin data

Trade and forced-labor risk often attaches below Tier-1

Prevents “sourced but not shippable” mistakes

Add firmware/toolchain coupling

Electronics failures often arise after physical substitution

Converts sourcing decisions into buildable decisions

Refresh monthly, and on every PCN/EOL

Static maps decay fast

Maintains decision usefulness

Minimum viable visibility

An electronics organization should not wait for the full graph to be complete before acting. A minimum-viable visibility checklist for the top-risk BOMs is sufficient to materially improve decision-making.

Must-have field

Why it matters

MPN and exact package code

Alternates often fail at package level

Approved manufacturer and approved vendor lists

Prevents master-data drift and unauthorized buys

Lifecycle state and last PCN/EOL event

Gives early redesign or LTB window

Known fab/node and OSAT/package path

Reveals upstream concentration

Compliance declarations

Prevents blocked shipments or requalification surprises

Authorized distribution coverage

Lowers counterfeit and broker exposure

Alternate part and qualification status

Separates theoretical from usable resilience

Firmware/toolchain dependency

Catches “software-broken” substitutions

NCNR and open backlog

Quantifies commercial exposure

Revenue and customer exposure

Enables prioritization

This level of product record control matters because BOM, PLM, and part-risk tools all depend on the same approved-source, lifecycle, and change-history data.

Real-time data feeds & governance

The most useful live electronics feeds are:

  • PCN and EOL notices

  • Distributor inventory and lead-time signals

  • Supplier commits and push-outs

  • Shipment arrival estimates and lane variance

  • Customs and tariff changes

  • Quality escapes and returns

  • Geopolitical and weather alerts

  • Internal consumption burn

External market feeds are most valuable when tied to a governed master data model instead of pulled into spreadsheets ad hoc. IPC’s sentiment reports and ECIA’s Industry Pulse show the direction, but they publish monthly or quarterly. On top-risk parts, lead times, allocation status, and distributor stock can shift within weeks, so monthly manual updates are too slow, and the distributor and risk-platform APIs carry the live signal.

A good governance model treats every new signal as one of four classes: authoritative, market intelligence, supplier assertion, or internal observation. Policy or engineering decisions should require at least one authoritative source for legal/compliance changes and at least two independent sources for scarcity claims. That prevents common failure modes such as believing a supplier’s optimism after a capacity event or overreacting to a one-off broker quote.

The digital thread

The desired digital thread connects PLM, ERP, MES, quality, and SCRM, with each system owning one part of the record:

  • PLM — form/fit/function, approved alternates, and ECOs

  • ERP — purchase orders (POs), NCNR, and vendor and financial exposure

  • MES — lot and build traceability

  • Quality — nonconformance reports (NCRs), returns, and qualification evidence

  • SCRM — external lifecycle, supply, geopolitical, compliance, and sub-tier mapping intelligence

At an EMS, where the AML belongs to the OEM customer, an alternate becomes usable only after a customer deviation or AML change, so the thread must reach the customer’s approval step. If AML/AVL, lifecycle, and change control are scattered across disconnected systems, resilience will remain manual and slow.

In a tariff-frontload period, distributor demand, inventory, and lead-time indices can spike due to pulled-forward orders and appear to be a structural chokepoint even when underlying capacity is fine, while supplier statements can understate the real tightness. Cross-validated data is what makes visibility useful.

Resilience strategies & design tradeoffs

There is no single best resilience strategy in electronics, because the right lever depends on the failure mode. Temporary logistics noise often yields to inventory and rerouting. A package or OSAT chokepoint rarely yields to rerouting; it clears through a package-qualified alternate, a redesign, the supplier qualifying a second assembly site, or contracted allocation, with inventory bridging the wait if it can be secured. And where trade policy is the constraint, geographic duality and customs engineering often matter more than extra stock.

US customs generally assigns a chip’s origin to the country where its wafer was fabricated, so moving assembly or ship-from alone may not change the duty. The strongest programs combine multi-sourcing, design-for-supply, selective buffering, and contractual reservation rather than betting on one tool.

Single sourcing and regional exposure often sit on the same BOM lines, as the sensor maker Leuze found when it re-evaluated a product built in Asia:

“We identified components that were either unavailable in Europe or restricted to a single source. After the analysis, we found alternatives that were more cost-effective and offered better availability. This allowed us to bring production back to Germany.”

— Dimitri Skoric, Project Procurement, Leuze

Resilience strategy decision matrix

Strategy

Best used when

Trade-off

Electronics realism test

True dual-source

Electrical and package compatibility can be qualified

Upside: strongest continuity
Downside: qualification cost, engineering overhead

Must prove distinct package/site path, not just two logos

Buffer stock

Risk is time-bounded or lane-sensitive

Upside: fastest to execute, while supply is still buyable and, at an EMS, once the customer authorizes the liability
Downside: working capital, obsolescence, NCNR mismatch

Avoid buffering fast-obsolescence parts without lifecycle confidence

Last-time-buy

EOL is known and redesign is slow

Upside: buys time for installed base or certification-heavy products
Downside: demand forecast error, dead stock risk

Needs verified LTB window and storage controls

Regional duality

Trade or geopolitical risk dominates

Upside: lowers policy and lane risk
Downside: higher cost, qualification effort

Works only if data and quality processes are mirrored

Design-for-supply

New product or mid-life redesign

Upside: structural reduction in single-point failure risk
Downside: upfront design tradeoffs

Must include package, firmware, and test implications

Capacity reservation or LTA

Chokepoint is known and strategic

Upside: improves priority and predictability
Downside: take-or-pay or NCNR liability, and locked prices if the market falls

Effective only if forecasts are credible

Vendor-managed inventory (VMI) or consignment

Demand is stable and supplier relationship is strong

Upside: reduces stockout risk at use point
Downside: less effective in strict allocation

Needs clear title, liability, and obsolescence terms

Design-for-supply checklist

Electronics resilience is won early in the design process, which is why resilience for OEMs starts at the design stage. The most useful checklist is:

Design question

Why it matters

Can the footprint accept more than one package or vendor family?

Avoids package-only lock-in

Is there a pin-compatible or near-pin-compatible alternate?

Reduces redesign scope

If not, can a mezzanine, daughtercard, or modular boundary isolate the risky part?

Contains future redesign cost

Is firmware abstracted from device-specific peripherals and timing assumptions?

Makes substitutions real, not cosmetic

Are there programmable substitutes for logic or control functions?

Adds options where exact alternates are scarce, with its own allocation and toolchain exposure

Is performance over-specified beyond real need?

Wider spec windows increase alternate pool

Are passives selected from dense, multi-supplier commodity families where possible?

Improves AML depth

Are critical components placed to allow rework or package migration?

Lowers ECO and service burden

Texas Instruments’ second-sourcing guidance and AMD’s package-footprint compatibility documentation both show why this matters: whether an alternate is feasible is often decided by PCB layout and package planning, long before procurement is involved.

📊 See which products an EOL puts at risk

Flag lifecycle, availability, and compliance risk on every BOM, and see which assemblies each part affects.

👉 Explore Risk (SCRM)

Buffer stock policy

A defensible buffer policy should distinguish base stock from shortage-mode stock. Use the normal variability model for baseline coverage, then apply a risk multiplier only to the small set of parts with high concentration, high revenue exposure, or long requalification time. A practical policy looks like this:

  • Base safety stock — set by demand and lead-time variability.

  • Shortage-mode uplift — added when leading indicators (lead-time slope, commit slippage, distributor depletion) or a policy shock cross a threshold, before formal allocation. Once allocation is declared, extra volume usually can’t be bought, and over-ordering is treated as phantom demand. PCN and EOL exposure goes through the LTB decision, not safety stock.

  • Lifecycle cap — no excess buys on parts with an unstable lifecycle or a likely redesign, and no more than date-code acceptance windows, moisture-sensitivity storage limits, and solderability aging allow.

  • Quarterly burn-down review — excess stock released against demand and roadmap updates.

This avoids the common mistake of treating all parts as shortage parts, which usually turns resilience into dead inventory. At an EMS, any buffer or uplift above customer demand also requires written customer authorization covering excess, obsolescence, and NCNR liability; otherwise, the EMS carries the stock.

Contracting levers that matter

For constrained categories, contracting levers deserve equal weight to sourcing tactics, and they must be reflected in the OEM–EMS agreement: when the EMS buys turnkey, every NCNR commitment, last-time buy, or shortage buffer placed on the OEM’s forecast becomes an excess-and-obsolete liability unless the contract specifies who owns it.

In 2026, the most relevant levers are:

  • LTAs with explicit volume bands

  • NCNR clauses linked to forecast validity windows

  • Capacity reservations for package and test or strategic materials

  • VMI or consignment for stable-demand lines

  • Priority or escalation language tied to collaboration and commit behavior

Buyers negotiating any of the above are competing against commitments that already extend years ahead: in the tightest memory categories, non-cancelable volume is booked well beyond the usual planning horizon, and some supply agreements already run through the end of the decade. Supplier emphasis on specific commitments and multiyear discussions, combined with allocation in memory, shows that “purchase order only” operating models are too weak for the most constrained categories.

Passives show the same selective pressure. In August 2026, TrendForce reported MLCC lead times diverging: standard parts held at 14–18 weeks, while some high-end parts stretched to around 40 weeks. Teams with parametric-approved alternates and spec flexibility can absorb that kind of selective pressure; teams with frozen, over-tight specs cannot.

Risk scoring, KPIs, dashboards & escalation

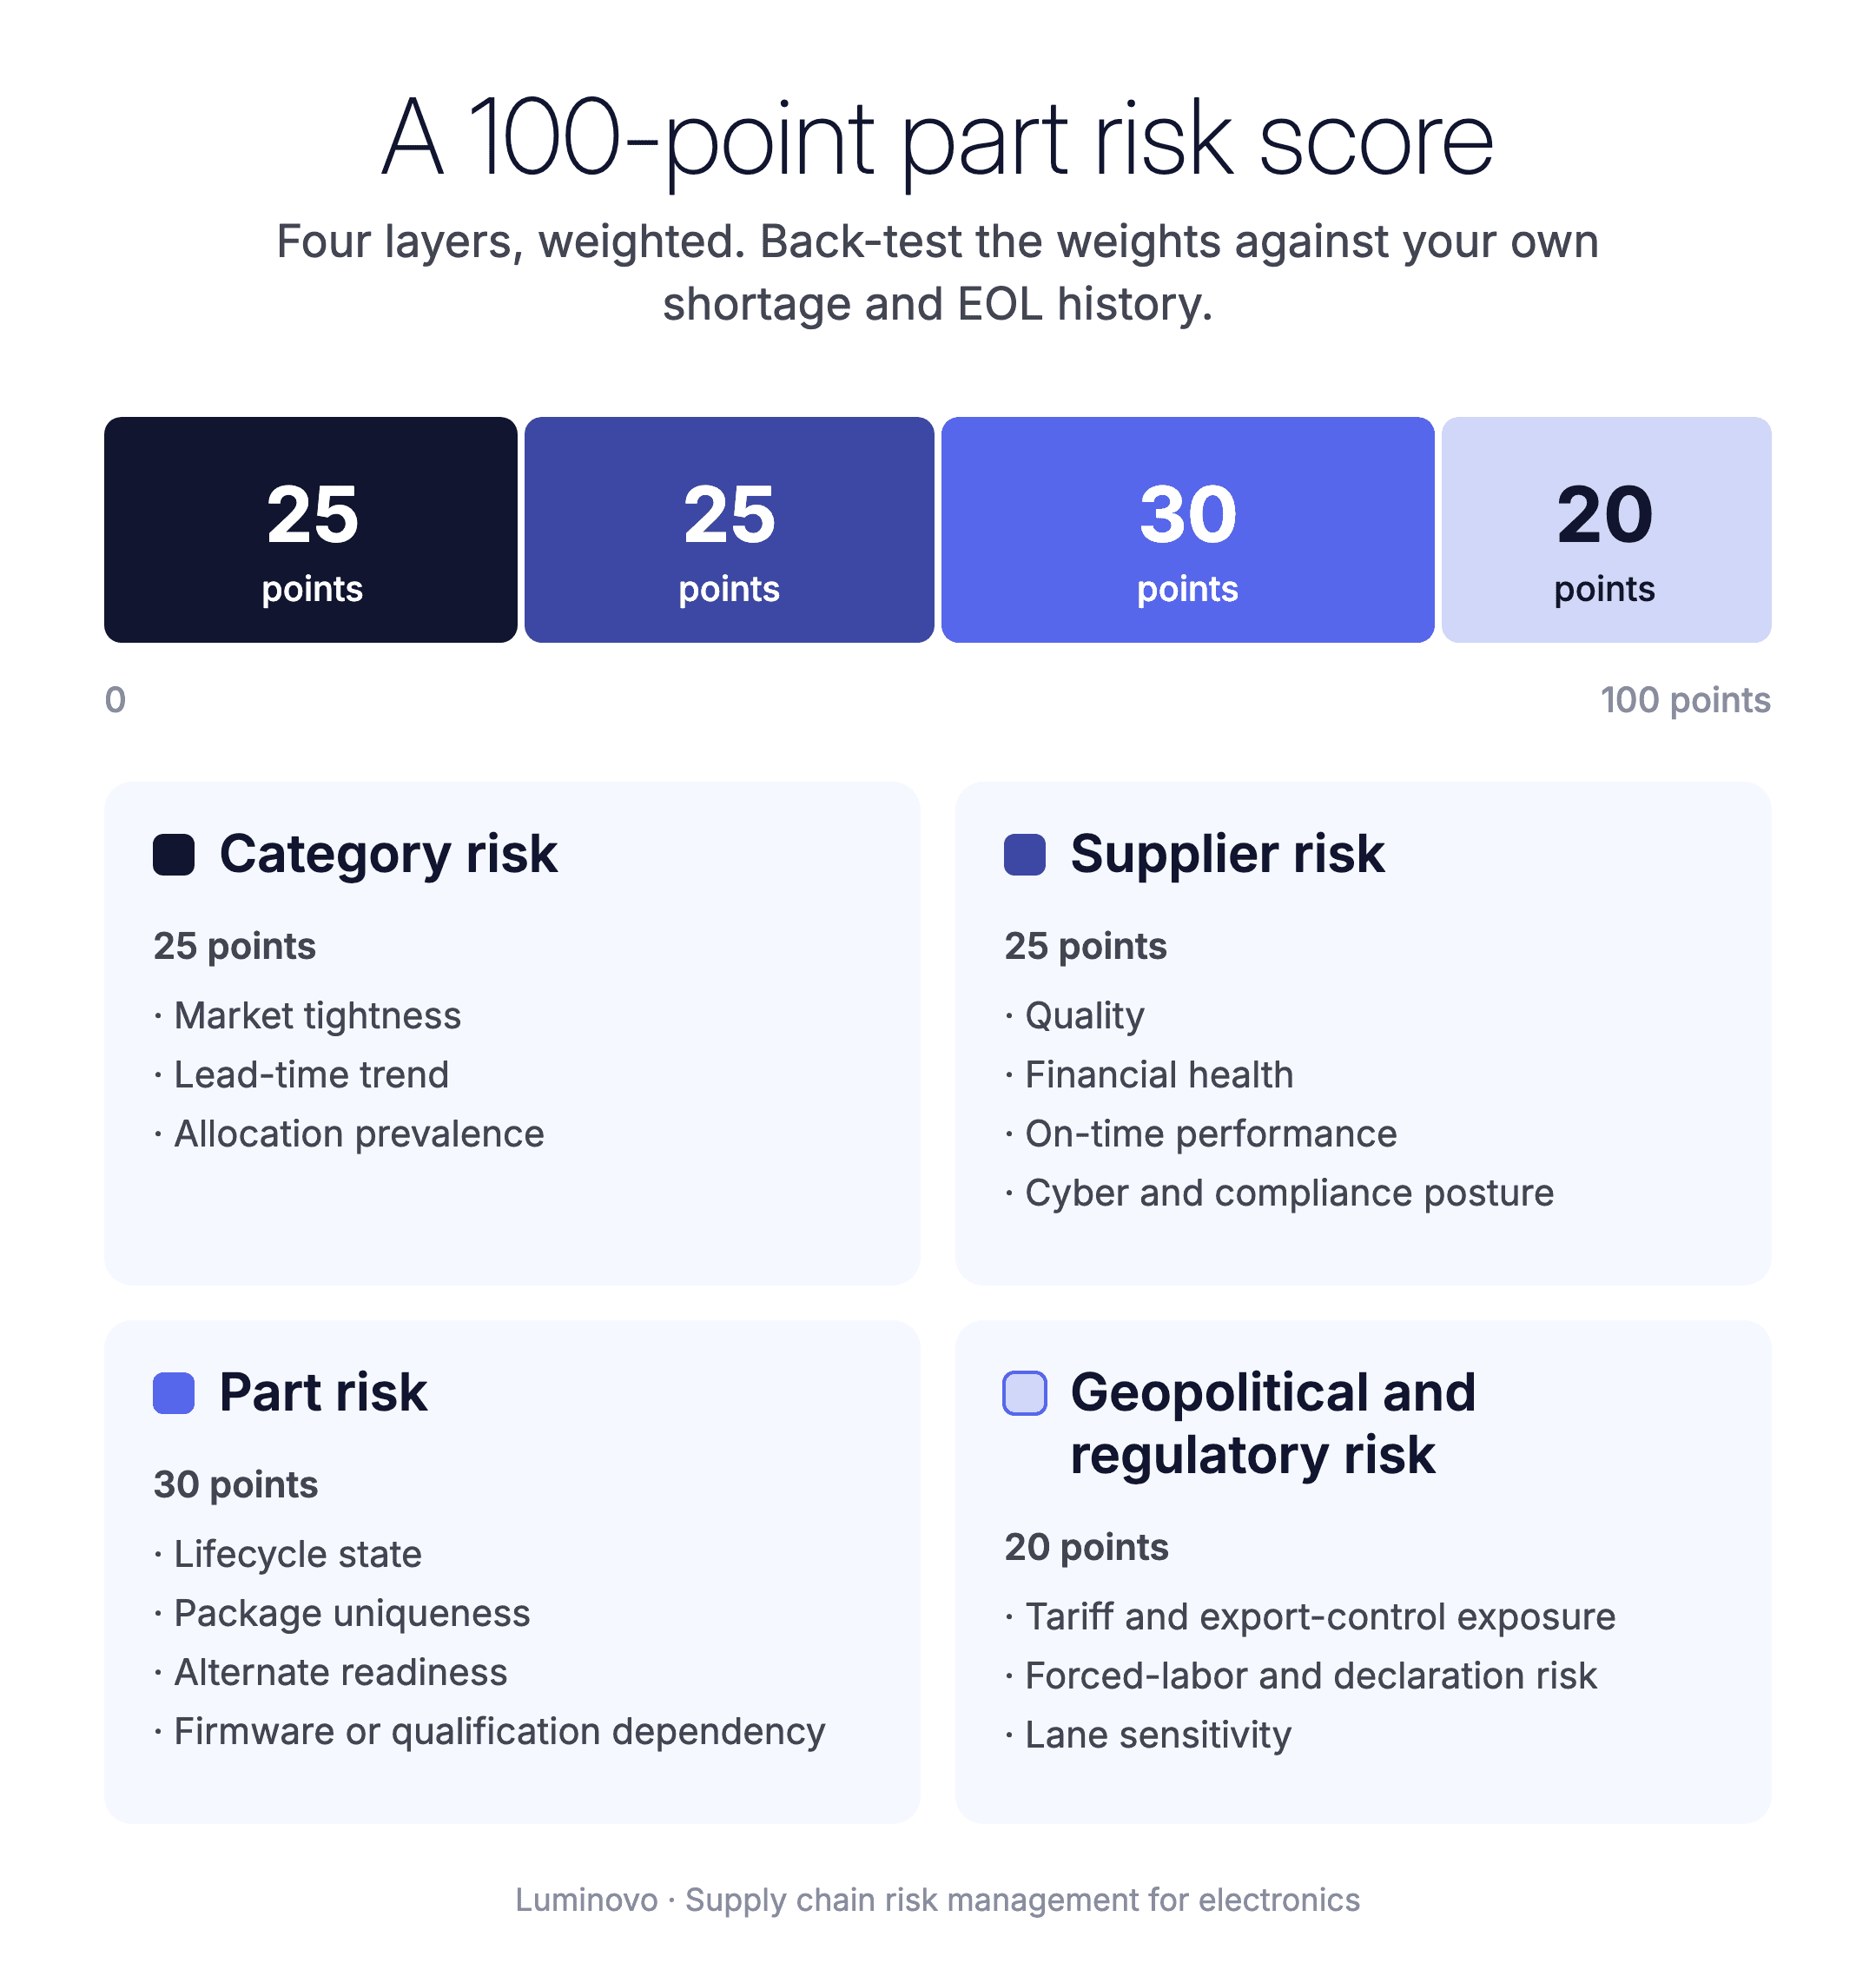
The most useful electronics score is a stacked score reflecting four layers: category risk, supplier risk, part risk, and policy/geography risk. That structure matches what SCRM platforms do in different ways and aligns with the semiconductor resilience literature: risk emerges from the network, not from an isolated vendor record.

Sample scoring model

A practical 100-point model is:

  • Category risk (25 points) — market tightness, lead-time trend, and allocation prevalence

  • Supplier risk (25 points) — quality, financial health, on-time performance, and cyber and compliance posture

  • Part risk (30 points) — lifecycle state, package uniqueness, alternate readiness, and firmware or qualification dependency

  • Geopolitical and regulatory risk (20 points) — tariff and export-control exposure, forced-labor and declaration risk, and lane sensitivity
Within part risk, the most predictive electronics fields tend to be lifecycle notice quality, package uniqueness, and qualified-alternate depth. Within category risk, the most predictive fields are lead-time slope and allocation flags.

The category emphasis matches recent allocation in memory and packaging; the part-level emphasis comes from EOL and package-migration events. The weights below map to the four layers (category 25, supplier 25, part 30, geopolitical and regulatory 20). Treat them as a starting point and back-test them against your own shortage and EOL history.

Example part scorecard

Dimension

Weight

Example metric

Threshold concern

Lead-time slope

13

Change in supplier-confirmed lead time over 30 days, in %

>20% increase in 30 days

Allocation status

12

Binary or graded

Any allocation on top-25 revenue part

Lifecycle risk

10

Active/NRND/EOL / no-PCN EOL trend

NRND or recent EOL family

Alternate readiness

8

Qualified alternates count

No qualified alternate for a commodity part, or no mitigation plan for a sole-source part

Package uniqueness

6

Unique footprint/package family

Sole package path

Compliance exposure

8

Missing/aging declarations

Any gap on ship-critical part

Authorized coverage

6

Authorized stock path available

Broker-only path

Supplier operational health

25

OTIF, quality escapes, commit misses

Two-period deterioration

Geopolitical/trade exposure

12

Tariff/export-control/lane concentration

Any controlled or repriced flow

Scores of 0–29 mean monitor, 30–49 buyer action, 50–69 cross-functional review, and 70+ executive review and response plan. To decide which parts to work on first, weigh each score by exposure, meaning how many assemblies a part can stop and how much revenue they carry. A part that scores 60 and can stop ten assemblies comes before one that scores 70 and stops one.

Our OEM procurement playbook applies the same ranking to sourcing decisions. These cutoffs are organizational choices, but the structure holds up because it ties score movement to observable signals.

KPI set with owners & failure modes

The table below turns the scoring model into operating metrics.

KPI

Formula

Owner & cadence

Where it misleads

Lead-time slope
Speed of deterioration

(LT current – LT 30d ago) / LT 30d ago

Commodity manager · weekly

Supplier stops publishing or masks with “TBD”

Commit volatility
Instability in confirmations

Std. dev. of weekly commits / mean commit

Supply planning · weekly

Looks stable when demand already rationed

Allocation flag rate
Share of critical parts under allocation

Allocated critical parts / total critical parts

Procurement · weekly

Informal allocation not formally declared

PCN velocity
Rate of product/process changes

PCNs per 1,000 active MPNs

Engineering quality · monthly

Low count can hide missing notices

EOL coverage gap
EOL events without qualified alternate

EOL parts without alternate / total EOL parts

Engineering · monthly

Alternate exists on paper but not qualified

AML depth
Resilience of approved supply base

Qualified sources per critical part

Component engineering · monthly

Shared sub-tier makes depth look better than reality

NCNR at risk
Commercial exposure to obsolete or repriced stock

NCNR value on at-risk parts

Procurement finance · monthly

Excludes future liability in backlog

Broker dependency ratio
Authenticity risk under shortage

Broker spend / total acute-buy spend

Procurement quality · weekly

Independent-distributor stock tagged as authorized, or franchised excess-inventory programs counted as broker spend

OTIF drift
Operating deterioration

OTIF current – OTIF trailing quarter

Supplier management · monthly

Temporary expedite masks systemic miss

Expedite premium
Cost of reactive posture

Expedite/logistics premium as % of material cost

Operations finance · monthly

Normalized cost can hide service damage

Revenue at risk
Commercial impact if part fails

Revenue tied to open demand of at-risk part

Sales and operations planning (S&OP) / finance · weekly

Assumes no substitution or customer reprioritization

These KPIs are useful because they split leading indicators from lagging indicators. Lead-time slope and PCN velocity provide early warning, but quoted lead times are inflated by double-ordering, and allocation flags usually appear only after a shortage has already started, so pair them with distributor inventory weeks and book-to-bill. OTIF drift and expedite premium tell you what already went wrong.

Dashboard views that matter

The most decision-useful dashboards in electronics are usually these four:

Dashboard

Purpose

Top 25 at-risk parts

Prioritizes scarce management attention

Single points of failure

Shows parts with low AML depth and shared sub-tier dependence

Revenue at risk

Translates supply risk into business language

NCNR and buffer exposure

Prevents “resilience” from becoming stranded inventory

Part-intelligence and SCRM graph platforms all market variations of these views, because they correspond to real decision moments in electronics programs.

Escalation policy

Level

Trigger

Response

Executive cadence

Buyer action

Score 30–49 or mild KPI movement

Buyer-led watchlist and alternate check

Monthly

Managed exception

Score 50–69, allocation on non-top part, or PCN with moderate design impact

Cross-functional review with engineering and quality

Biweekly

War-room

Score 70+, a top-25 part on allocation, no alternate with a confirmed gap, or a trade disruption

Daily action tracker; supplier escalation; customer impact analysis

Twice weekly

Executive crisis

Imminent line stop, major revenue-at-risk, export-control block, or counterfeit suspicion on critical build

Executive sponsor, legal/compliance review, scenario decisions

Daily

The most common escalation failure is threshold inflation: teams wait for hard line-stop evidence before escalating. In electronics, by the time the line is at risk, the qualifying actions may already be too late.

The pattern of discontinuations arriving without formal notice shows why a lagging dashboard fails. If many EOL events arrive without normal notice, the program must proactively monitor alternate coverage and lifecycle forecasts, not just incoming PCN inboxes. Our PCBA obsolescence checklist is a quick way to see where a program stands.

Response playbooks, tooling & operating model

Response playbooks work only when decision gates are explicit. Electronics teams frequently know what can be done but lose time deciding who can authorize what. The four scenarios below should therefore be pre-approved with owners, along with evidence requirements and stop/go gates.

Scenario playbooks & decision gates

1. Shortage and allocation

  • First 24 hours — confirm exact part/package/site; freeze demand assumptions; verify authorized stock

  • 24–72 hours — supplier escalation; screen alternates; assess broker need under anti-counterfeit controls (at an EMS, a broker buy and its price premium also need the OEM customer’s written approval before the PO is placed)

  • 3–10 days — reallocate demand, execute expedites selectively, customer communication

  • Decision gate — ship with existing source, switch to alternate (at an EMS, only with the OEM customer’s approved deviation or AML update), or ration demand across programs and customers

2. PCN

  • First 24 hours — classify change type and affected assemblies; open impact case

  • 24–72 hours — engineering impact analysis, supplier Q&A, qualification plan

  • 3–10 days — secure bridge stock of pre-change material; start qualification builds and reliability testing, which often take weeks to months for fab, die, or assembly-site changes; get customer approval where the OEM owns the AML; approve the ECO and update AML/AVL when qualification closes

  • Decision gate — accept as-is; request samples, an extension, or a last-time buy of pre-change material; or move to a qualified alternate path

3. EOL

  • First 24 hours — verify LTB window, remaining stock, installed-base demand

  • 24–72 hours — size installed-base and service demand; open the lifetime-buy versus redesign analysis with a decision date set well inside the LTB window

  • 3–10 days — model storage, attrition, and service burden; prepare the LTB quantity (at an EMS, with the OEM customer’s written liability authorization for the NCNR buy) or redesign milestone plan for approval

  • Decision gate — lTB, redesign, replace product, or service strategy change

4. Geopolitical/trade disruption

  • First 24 hours — classify legal exposure; stop non-compliant flows

  • 24–72 hours — reroute lanes, re-cost BOM, verify customs and license path

  • 3–10 days — regional re-source, customer promise-date reset, contract invocation

  • Decision gate — continue flow, pause flow, or shift geography

JEDEC change/discontinuance standards, Microchip’s PCN/EOL policy, supply chain risk guidance from the Cybersecurity and Infrastructure Security Agency (CISA) and BIS, and counterfeiting controls under the Defense Federal Acquisition Regulation Supplement (DFARS) and the Defense Logistics Agency (DLA) all support the sequence above: classify first, contain second, decide with evidence third.

Lean RACI matrix for crisis response

In the table, A = accountable, R = responsible, C = consulted, and I = informed. The executive sponsor (C*) is consulted by default and approves at the war-room and executive-crisis levels, on major ECO costs, on last-time buy and redesign funding, and on any decision to pause flow or shift geography.

Role

Shortage

PCN

EOL

Geopolitical

Commodity management

A/R

C

R

C

Component engineering

C

A/R

A/R

C

Quality and reliability

C

R

C

C

Compliance and legal

C

C

I

A/R

Operations/planning

R

C

C

R

Finance

C

I

C

R

Executive sponsor

C*

C*

C*

C*

Supply risk briefing

Escalations move faster when every brief has the same shape: what changed, which parts and assemblies are affected and what revenue is exposed, the evidence (a supplier statement, an independent market signal, and your own demand and backlog), two or three options, a recommendation, a decision deadline, and a named owner.

⚡ Run OEM procurement from one live BOM

Source, quote, and track supplier and part risk for every product in one platform.

👉 See the OEM platform

Software & tooling

Electronics teams should separate generic SCRM from electronics-native product continuity. The second category matters because BOM-level lifecycle and package intelligence are where many actual line-stop risks originate. The market for SCRM software is broad, but the useful categories for electronics are fairly clear.

Generic supplier-risk platforms

Enterprise supplier-risk platforms are built around automated assessment, exposure calculation, issue-management workflows, and incident monitoring, scored across operational, financial, compliance, cyber, sustainability, and geopolitical dimensions.

They are strongest when the problem is enterprise-level supplier exposure and workflow orchestration across every category a company buys. They are weakest at the part level, which, in electronics, is where the line-stop risk lies: a supplier score that isn’t connected to the BOM will not tell you that a single package has only one qualified source.

ERP & procurement backbone

The ERP and procurement backbone matters because it is where supplier masters, purchase orders, contracts, receipts, planning data, and exception workflows live. An SCRM program that cannot read that data stays observational rather than operational. For most companies, the ERP layer is where risk decisions become spend decisions.

Electronics intelligence layer

This is the most underappreciated piece of the stack. Part-intelligence tools are built around BOM automation, electronic-parts databases, and lifecycle risk analysis, which connect SCRM to engineering reality: approved manufacturer parts, alternates, lifecycle status, compliance flags, and BOM-level exposure. A company without reliable part intelligence can still build decent supplier-risk dashboards, but it will struggle to answer the harder question: “Which exact assemblies fail if this part, package, PCN, or EOL event moves against us?”

Control-tower & monitoring capability

The Defense Business Board’s January 2025 supply chain illumination report points toward a modular stack with digital BOMs, selective near-real-time monitoring, and advanced analytics. This category includes shipment tracking, event monitoring, control-tower logic, risk propagation, and decision support.

The key design rule here is selectivity. The DBB explicitly argues for focusing near-real-time visibility on critical risk areas. In electronics, that usually means line-critical semiconductors, constrained passives, regionally exposed logistics lanes, and policy-driven exceptions rather than blanket monitoring of the entire catalog.

What to look for in SCRM software

The best software evaluation criteria for electronics are capability tests, starting with whether the tool supports multi-tier mapping and links suppliers to part numbers and part numbers to product BOMs. Here is a quick guide:

Capability

Why it matters in electronics

Minimum proof in demo

BOM ingestion at MPN/package level

Risk sits below supplier name

Live upload with package-aware rollup

PCN/EOL automation

Lifecycle change is continuous

Show notice ingestion, dedupe, assignment, closure

Multi-tier graph with part-to-site mapping

Shared chokepoints hide sub-tier

Show one part mapped to fab/OSAT/site or raw-material node

Parametric alternates and form-fit-function logic

Alternates must be technically usable

Show graded alternates and qualification status

Distributor and inventory integration

Market speed matters

Show authorized-stock and lead-time overlay

Compliance and trade content

Part may be buyable but not shippable

Show RoHS, REACH, forced-labor, and export checks on a BOM

ERP/PLM/MES integration

Decisions fail without master-data sync

Show how an approved AML/AVL or lifecycle change reaches your PLM/ERP

Audit trail and workflow

Crisis decisions must be reviewable

Show owner, timestamp, rationale, closeout

Explainability

Black-box scores undermine action

Show score decomposition by part

Security and retention

BOMs and supplier graphs are sensitive

Show role-based access and retention controls

Electronics-native platforms cluster around these capabilities in different ways. Some center BOM and lifecycle risk, some emphasize multi-tier part-to-site mapping, some graph scoring across risk domains, and some connect design-stage BOM decisions to market signals. SiliconExpert and Accuris, two of the part-data sources Luminovo connects to, center BOM, approved-manufacturer, and lifecycle control. Luminovo’s Risk (SCRM) works at the BOM level described above: lifecycle, availability, and compliance flags on the parts in a live product.

Test vendors on your own BOM

In a demo, ask each vendor to work on one of your live BOMs with at least 500 MPNs: flag PCN, EOL, and compliance issues, rank the top ten parts by continuity risk, and explain why each proposed alternate is or isn’t suitable. Then have them trace one critical part through its supplier, site, and sub-tier exposure. Expect the sub-tier view to stop where manufacturers stop disclosing, and ask which data source and license tier each flag comes from, especially PCNs.

Target operating model & roadmap

Time frame

What to implement

First 30 days

Stand up top-25 part watchlist; define scorecard; assign owners; begin weekly risk review

By 60 days

Visibility on top-25 parts, PCN and EOL monitoring on, shortage and PCN playbooks live

By 90 days

Add revenue-at-risk and NCNR dashboards; pilot alternate qualification workflow; formalize executive escalation

By 12 months

Mapping to top-100 parts and key sub-tier sites, SCRM linked to PLM and ERP, design-for-supply in product launch gates, quarterly playbook audits

Training should focus less on tool usage and more on decision rights: who can approve broker buys, who can approve NCNR commitments, who owns alternate qualification timing, who decides customer reprioritization, and who signs off on geopolitical holds. That is where many otherwise capable programs still fail.

Fix the data before buying tools

Software does not create resilience on its own. The Defense Business Board’s findings repeatedly point to mapped critical supply chains, digital BOMs, modular technology stacks, and well-governed data.

In electronics, SCRM tools are most effective when master data, engineering change governance, approved source lists, lifecycle monitoring, and trade or compliance attributes are already governed well enough to trust. When those foundations are weak, new tools often become expensive ways to display the same ambiguity faster.

Glossary

  • ABF (Ajinomoto build-up film): The insulating material used in the build-up layers of advanced chip substrates.

  • Allocation: A supplier rationing constrained output across customers, whether by contract, by strategic preference, or through distribution.

  • AML/AVL (approved manufacturer list and approved vendor list): The controlled lists of which manufacturer part numbers are approved for an internal part and which sources may supply them. At an EMS, the OEM customer usually controls the AML, while source selection often stays with the EMS within the customer’s authorized-channel rules.

  • CoWoS (chip-on-wafer-on-substrate): TSMC’s 2.5D advanced packaging technology, used to pair AI accelerators with high-bandwidth memory.

  • EMS/ODM (electronics manufacturing services provider and original design manufacturer): Companies that build products for OEMs, and in the ODM’s case also design them.

  • EOL/NRND (end of life and not recommended for new designs): Lifecycle states that signal a part is being discontinued or should stay out of new designs.

  • HBM (high-bandwidth memory): Stacked DRAM packaged next to AI accelerators.

  • Lead-time slope: The percentage change in supplier-confirmed lead time over a set period, usually 30 days; an early-warning signal for shortages.

  • LTA (long-term agreement): A multi-period supply contract with volume bands, pricing, and priority terms, often in exchange for volume commitments that range from rolling forecasts to take-or-pay.

  • LTB (last-time buy): The final order, usually NCNR, that a customer can place before a part is discontinued, sized to cover remaining production and service demand.

  • MPN (manufacturer part number): The manufacturer’s identifier for a part, whose full orderable form also encodes package, packaging, and grade.

  • NCNR (non-cancelable, non-returnable): A purchase condition common for long-lead, allocated, or special-order parts.

  • OCM (original component manufacturer): The company whose name and part number the component carries, and which controls its authorized sales channel.

  • OEM (original equipment manufacturer): The company that owns and sells the finished product, and usually controls its AML.

  • OSAT (outsourced semiconductor assembly and test): The providers that package and test chips after wafer fabrication.

  • OTIF (on-time in-full): The share of order lines delivered in full within an agreed window of a fixed baseline date, such as the customer request date.

  • PCN/PDN (product change notification and product discontinuance notice): The formal manufacturer notices for part changes and discontinuations, set out in J-STD-046 and J-STD-048.

  • PLM/ERP/MES (product lifecycle management, enterprise resource planning, and manufacturing execution system): The systems that hold the product record, the commercial and planning data, and the build record.

  • RACI (responsible, accountable, consulted, informed): A matrix that assigns decision rights for each response scenario.

  • SCRM (supply chain risk management): Identifying where supply can fail, how likely and how damaging each failure would be, what to do about it, and how fast the organization detects and responds.

  • SRM (supplier relationship management): How a company segments, measures, and develops its suppliers, producing the performance data that sourcing and risk decisions draw on.

  • Tier-1/sub-tier: Tier-1 suppliers sell to you directly; sub-tier suppliers (Tier-2, Tier-3), such as fabs, OSATs, and substrate makers, sit behind them. When you buy through distribution, the distributor is your commercial Tier-1, but the OCM still sets allocation, lifecycle status, and change notices.

  • VMI/consignment (vendor-managed inventory and consignment): Inventory models in which the supplier manages replenishment or retains title until the parts are used. Neither removes the buyer’s liability for excess or obsolete stock; the contract only shifts when and how much of it applies.

A single line on a bill of materials (BOM) can fail because of a late product change notification, a packaging bottleneck, or a supplier disruption. Your team needs to know the impact and who acts next.

Supply chain risk management (SCRM) for electronics is the capability to understand where the electronics supply chain can fail, how severely it would impact operations, what can be done about it, and how quickly an organization can detect and respond when conditions change.

That definition borrows the systematic-process structure of NIST’s supply chain guidance, written for cybersecurity but transferable, and applies it to electronics supply risk. It also reflects a practical electronics problem: component availability, tariffs, export controls, and product changes now move faster than annual planning cycles.

Electronics SCRM at a glance

Electronics supply chains are more fragile than most industrial ones. They combine extreme specialization, deep multi-tier opacity, fast component obsolescence, and a few hard bottlenecks at the wafer, advanced packaging, test, substrate, and critical-material levels.

Three forces sharpen that in 2026:

  • AI infrastructure demand is absorbing a disproportionate share of high-bandwidth memory (HBM), chip-on-wafer-on-substrate (CoWoS)-class packaging, leading-edge logic, and power infrastructure.

  • Export-control and tariff changes move landed cost or legal availability faster than design cycles.

  • Lifecycle events such as product change notifications (PCNs), end-of-life (EOL) notices, package changes, and firmware-toolchain dependencies can turn a “supply issue” into a redesign issue overnight.

📊 Three in four assemblies carry lifecycle risk

In a Luminovo analysis of nearly 38,000 electronic assemblies, 75% had at least one BOM line in which every approved part was not recommended for new designs (NRND), end-of-life, or obsolete.

Source: anonymized Luminovo platform data, September 2026. Customer assemblies with at least 20 BOM lines and known lifecycle status for at least half of their lines, duplicates removed, checked against current lifecycle status.

The four core pillars of SCRM

The guide runs in one order, with continuous improvement throughout.

1. Visibility

Map what each product depends on, from the BOM down to fab, package, and substrate.

2. Scoring

Rank exposure so attention goes to the parts that can stop a line.

3. Governance

Settle who decides what, and by when.

4. Playbooks

Turn each decision into a pre-approved response.

Teams that see only Tier-1 suppliers react late. Teams that can see BOM-to-fab, outsourced semiconductor assembly and test (OSAT), substrate, package, and compliance dependencies can rank exposure early, escalate only the issues that matter, and respond with the right lever: alternate, buffer, last-time buy (LTB), contract, redesign, or reroute. The same pattern runs through traceability work at NIST and IPC’s traceability standard.

This guide is for the people who own continuity: original equipment manufacturer (OEM) supply chain leaders, electronics manufacturing services (EMS) and original design manufacturer (ODM) operations teams, commodity managers, procurement, quality and compliance leads, and the engineers who own alternates, qualifications, and engineering change orders (ECOs). Every recommendation comes with an artifact, metric, or trigger you can use in live operations.

How to use this guide

Start with the taxonomy and watchlist, build minimum viable visibility for the top 25 revenue-critical parts (ranked by supply risk and by how much assembly revenue each part can stop, not by what the part itself costs), deploy the scorecard and escalation triggers, then formalize the four response playbooks. That sequence usually produces faster risk reduction than a big-bang software implementation.

Why supply chain risk management for electronics matters

In electronics, a single BOM line can depend on upstream wafer capacity, a specific fab node, a limited-package OSAT line, substrate build-up film, a particular test insert, distributor stock, and an EMS line qualification. The chain runs, from raw material to the field:

  1. Raw materials and specialty chemicals

  2. Wafers

  3. Fab

  4. Probe and test

  5. OSAT, fed by substrates and leadframes

  6. Authorized distribution or direct manufacturer supply

  7. EMS or ODM

  8. OEM

  9. Service and aftermarket

PCBs, connectors, and passives run as parallel supply chains, often bought directly from fabricators and manufacturers. Those dependencies are why supply chain issues in electronics rarely resolve at a single tier.

Across that flow sit control layers that often become hidden bottlenecks: lithography and etch tools, electronic design automation (EDA) tools and licensed IP, firmware, test programs, package footprints, and regulatory declarations.

What makes electronics different from other manufacturing sectors is the qualification burden attached to change. A pin-compatible alternate often stops being a drop-in replacement in practice: small differences in package tolerances, power profile, thermal behavior, oscillator behavior, memory timing, or software support can trigger PCB revision, validation, recertification, or field-service complications. AMD’s documentation on footprint compatibility shows that compatible sourcing is decided at the design stage.

The same is true for lifecycle management. Two JEDEC standards still set the baseline for notice: J-STD-046 for product and process changes, and J-STD-048 for discontinuance, which is announced through a product discontinuance notice (PDN). Compliance is uneven, though, especially among passive, electromechanical, and smaller component makers.

Many component discontinuations now arrive with no formal manufacturer notice, neither a PCN nor a PDN, leaving teams with less structured warning than the standards intend.

Part of the reason notices go missing is structural: formal notices go to the customer of record, and franchised distributors forward them to their buyers, often late or incompletely. An OEM whose parts its EMS buys turnkey, or that buys through brokers, often never sees them unless the EMS relays them. That is why automated lifecycle monitoring must track status changes, NRND flags, distributor stock behavior, and lifecycle forecasts, rather than wait for notices to arrive.

Contractually, the electronics market is also unusual. Long-term agreements (LTAs), non-cancelable, non-returnable (NCNR) provisions, allocation clauses, backlog/commit language, and volume-priority arrangements can decide continuity long before a public shortage is visible.

By December 2025, Micron had agreed price and volume for its entire calendar-2026 HBM supply and was negotiating multiyear contracts with specific commitments. Across DRAM, TrendForce reported buyers competing more aggressively for allocations in early 2026, while suppliers kept moving capacity toward server and HBM products.

In practice, “forecast discipline” has become as much a commercial control mechanism as a planning input.

🔗 Unify your entire EMS supply chain

Connect suppliers, customers, and internal teams in one real-time platform with shared workflows.

👉 Discover the platform

Common supply chain threat taxonomy

The table below maps the canonical risk families to electronics realities, tier exposure, and time horizon.

Risk family

In electronics

Leading signal

First action

Demand risk
0–12 months

AI-driven mix shifts, demand front-loading, channel distortion, sudden hyperscaler pull-ins

Forecast error, booking spike, design activity, distributor depletion

Freeze assumptions on critical BOM lines and segment demand by availability class

Supply risk
Immediate to 18 months

Fab bottlenecks, OSAT choke points, Ajinomoto build-up film (ABF) limits, yield and test constraints

Lead-time slope, allocation flags, wafer/package bookings

Identify shared sub-tier dependencies, qualify alternates, reserve capacity

Geopolitical risk
Immediate to multi-year

Export controls, tariffs, sanctions, industrial-policy intervention, shipping choke points

Legal notices, customs changes, crisis-stage triggers, freight reroutes

Legal review, trade re-costing, geographic dual-path plan

Regulatory and compliance risk
1–18 months

RoHS, REACH, and PFAS rule changes, forced-labor detentions, EU cyber rules, missing declarations

New substance thresholds, detentions, declaration expiries

Compliance refresh on top BOMs, document traceability, supplier attestations

Operational risk
Immediate to six months

Factory outages, cyber incidents, ERP/PLM data breaks, stale approved manufacturer and vendor lists (AML/AVL)

On-time in-full (OTIF) drift, ECO latency, mismatched part records, quality alerts

Data governance, escalation, contingency build plan

Lifecycle risk
One month to five years

PCN/EOL, NRND, missing notices, package migration, toolchain and firmware lock-in

PCN velocity, lifecycle forecast, manufacturer notices

Triage, qualify, LTB or redesign

Authenticity and quality risk
Immediate to 12 months

Counterfeit or broker exposure, unauthorized sourcing, latent defects, quality escapes

Broker share, suspect lots, quality escapes, test failures

Authorized-only sourcing default, screening, quarantine and traceability

Tailored risk register schema

A usable electronics risk register should track more than “supplier” and “lead time.” At minimum, it needs five groups of fields, which reflect today’s real failure modes at the part level:

  • Part identity — internal part number, manufacturer part number (MPN), and package and footprint

  • Supply path — fab and node if known, OSAT or package house, substrate or leadframe dependency, country of origin and ship-from, and authorized vs. broker path

  • Alternates and lifecycle — AML depth, alternate and qualification status, firmware and toolchain dependency, lifecycle status, and PCN or EOL date

  • Commercial exposure — NCNR exposure, tariff and export-control exposure, current lead time, lead-time slope, and revenue at risk

  • Ownership — a named owner for every line

In practice, a part can look “dual-source” at Tier-1 while actually sharing the same hidden OSAT or substrate supplier across two approved manufacturers. That is why paper dual-sourcing often fails under stress. Part-to-site and sub-tier mapping are more useful than supplier-count metrics alone.

Electronics supply chain risk in 2026

The highest-confidence 2026 demand signal is concentration around AI infrastructure. TrendForce reported that Taiwan Semiconductor Manufacturing Company (TSMC) projects AI-accelerator wafer demand to rise elevenfold from 2022 to 2026. It also reported that AI demand had tightened both 3 nm–2 nm wafer capacity and 2.5D/3D advanced packaging, with the CoWoS shortage spilling upstream into production equipment and downstream into substrates, packaging materials, and other critical components.

The spillovers matter as much as the headline GPU story.

Memory was the tightest segment in early 2026, as DRAM suppliers kept moving advanced nodes and new capacity toward server and HBM products. Power parts followed: TrendForce expects power-management IC lead times to stretch from 21–26 weeks to 35–40 weeks. So did high-capacitance multilayer ceramic capacitors (MLCCs), where makers’ book-to-bill ratios hit post-pandemic highs. Market signals in 2026 pointed to memory price growth and renewed MLCC tightness rather than a broad-based shortage.

The 2026 market is strategically tight in a handful of AI-exposed categories, while much of the rest has normalized. A missing part from a normalized category still stops a build, so monitoring can’t stop at the tight ones.

Allocation regimes in 2026

Allocation has shifted from emergency language to a continuing commercial model in some categories, especially memory. The reason is structural and commercial: new capacity takes years to add, memory makers have held back investment since the last downturn, and wafer capacity has shifted to HBM, which consumes far more wafer per bit than standard DRAM.

Allocation is how suppliers ration what remains and also serves as a pricing and customer-prioritization tool.

The practical regimes now seen in the market are: hard allocation with supplier-controlled shipping windows; contracted allocation with tied price/volume commitments; informal preference allocation where supplier behavior favors strategic accounts; and distribution-mediated allocation where inventory exists, but access depends on relationships and a credible backlog.

A workable “customer-of-choice” playbook in this environment comes down to six concrete behaviors:

  • A meaningful and growing share of the supplier’s spend

  • A strong design-win and design-registration position

  • Forecast accuracy

  • Fast NCNR decisions when justified

  • Clean debit and claim behavior

  • Engineering engagement on alternates and roadmap transitions

For EMS providers, allocation on customer-controlled parts often flows through the OEM’s own agreements, so the OEM’s backing for the EMS demand matters as much as the EMS relationship itself.

Those behaviors are the operational substance of supplier relationship management (SRM): risk explains why a supplier base needs to be managed, and SRM is how that management is carried out.

ASCM’s procurement guidance reinforces the same principle: suppliers reserve flexibility for customers who remove planning volatility and commercial friction.

The memory chip shortage shows where this leads: the Korea Herald reported in August 2026 that SK hynix’s chief executive expects it to last through 2030.

The lesson for OEMs is that under persistent allocation, volume, strategic weight, and signed commitments decide each buyer’s share, and a credible forecast is what keeps a smaller buyer’s share from being cut first.

Tariffs, export controls & crisis powers

The most material policy developments for electronics leaders to monitor in 2026 are multinational in scope.

In the United States, tariff policy has moved fast. Tariffs imposed under the International Emergency Economic Powers Act (IEEPA) were terminated in February 2026 by Executive Order 14389, which expressly preserved duties resting on other authorities. Tariffs under Section 301 of the Trade Act of 1974 and Section 232 of the Trade Expansion Act of 1962 remain in place.

Related to artificial intelligence, the January 2026 Section 232 proclamation established a framework to adjust imports of semiconductors, semiconductor manufacturing equipment, and derivative products, including an immediate 25% duty on certain advanced computing chips and derivative products under specified conditions, while signaling possible broader semiconductor tariff actions.

At the same time, the Bureau of Industry and Security (BIS) moved license reviews for certain advanced computing chips exported from the US to China and Macau to case-by-case in a January 2026 rule, and its May 2026 guidance confirmed that exporting advanced computing items to entities headquartered in Country Group D:5 or Macau still requires a license.

In Europe, the Chips Act already contains a crisis-response pillar with monitoring, a semiconductor alert system, the European Semiconductor Board, and the possibility of a “crisis stage”; the Commission also ran a semiconductor supply-disruption simulation with all 27 member states in November 2025.

In June 2026, the Commission published its Chips Act 2.0 proposal, which the European Parliament and member states still have to agree on. Under the existing act, once a crisis stage is activated, the Commission can, as a last resort, require integrated production facilities and open EU foundries to accept and prioritize orders for crisis-relevant products, so European supply is exposed to intervention as well as to subsidies.

China’s controls on gallium, germanium, graphite, tungsten, tellurium, bismuth, molybdenum, indium, and some rare-earth items have made “critical-material exposure” a live electronics risk rather than a mining-sector abstraction. The Netherlands tightened export controls on advanced semiconductor manufacturing equipment, effective April 2025, adding another layer of uncertainty for advanced fabs.

These regimes matter even for mature-node OEMs because they can affect tool service, materials, pricing, and midstream availability, not only frontier AI accelerators.

Government action can also hit a single supplier directly, and the damage lands unevenly across OEMs, EMS providers, and PCB makers. The Nexperia episode is a recent worked example: a Dutch government intervention in the company and a retaliatory Chinese export ban on its China-assembled output cut supply without any material or equipment control involved.

Category heatmap

Category

2026 posture

Why it matters now

Practical response

HBM and server DRAM

Severe

Allocated supply, multiyear commitments, AI crowd-out

Lock contract cover, prioritize uses, pre-qualify alternate densities and modules; HBM comes only via the accelerator vendor

Advanced packaging and CoWoS-class services

Severe

Bottleneck shifted downstream from wafers to packaging

Secure allocation from the accelerator vendor and lock delivery dates; only direct silicon customers can reserve capacity

ABF substrates and packaging materials

High

Packaging expansion pulls substrates and materials

Identify shared substrate exposure, add supplier/site mapping

Power semiconductors and power passives

High

AI data-center build-out raises server and power infrastructure demand

Buffer selectively, secure alternates, split demand by program criticality

High-CV MLCCs

High

AI server content and selective tightness

Pre-qualify alternates, widen spec bands where safe

MCUs and embedded processing

Medium

Normalized versus crisis years, but still exposed to package and tariff shocks

Watch lead-time slope and package-specific scarcity

Analog and standard logic

Medium

Selective tightness, occasional supplier disruptions

Maintain alternates and monitor package constraints

General connectors/interconnects

Medium

Metal-cost and demand pressure more than broad shortage

Hedge long-commit programs, track pricing separately from lead time

The best way to triangulate this heatmap is to require three lenses before changing policy: a statement from the original component manufacturer (OCM) or distributor, an independent market signal, and your own demand and consumption data.

For example, supplier claims of normalization should be checked against ECIA’s Industry Pulse lead-time survey, distributor inventory behavior, and your own commit volatility. That prevents overbuying in a tariff-frontload market and underbuying in a structurally allocated market.

2026 watchlist

Risk theme

Leading indicator

Data source

Trigger

Memory allocation deepens

HBM and DRAM price and allocation-only contract signals

Micron investor relations, TrendForce, Wall Street Journal

Any critical memory line marked allocation-only for two consecutive reviews

Packaging bottleneck migrates upstream

CoWoS queue growth, substrate tightness

TrendForce, TSMC, SEMI

20%+ increase in package lead time or capacity reservation refusals

Tariff repricing shock

New Section 232 scope, broker price jumps

Federal Register, White House, customs broker

BOM re-cost >3% on critical product family

Export-control denial risk

BIS guidance/rule change, license delays

BIS, legal counsel

Any affected item lacks classification and routing rule within five business days

Forced-labor or compliance interruption

Detentions, declaration gaps, supplier slow responses

US Customs and Border Protection (CBP), supplier portal, risk-intelligence feeds

Missing declaration on top-50 revenue parts beyond review deadline

Lifecycle surprise

PCN velocity, EOL without notice

Manufacturer PCN/PDN systems, part-lifecycle data providers, distributor notices

Any top-25 part enters NRND/EOL without qualified alternate

Legacy-node EOL accelerates

EOL notices on mature-node parts arriving ahead of published roadmaps

Manufacturer PCN systems, distributor notices

A top-25 legacy-node part gets an EOL notice with a buy window shorter than your redesign time

Logistics reroute

Suez/Red Sea/Hormuz disruption

Freightos, carriers, forwarders

Transit-time variance >30% on critical lanes

Visibility as the foundation

Supply chain visibility in electronics must be multi-tier, starting at the part level and extending to the site level. Supplier names alone are insufficient because multiple approved sources can collapse into a single hidden fab, OSAT, substrate supplier, or even toolset dependency.

Best practice is to combine three methods, knowing each has limits:

  1. Supplier questionnaires for declared dependencies. Component manufacturers often decline to name fab or assembly sites, or disclose them only under a nondisclosure agreement.

  2. Site-level evidence from PCN site changes, qualification reports, country-of-origin data, and lot or date-code markings.

  3. External graph enrichment from specialist mapping tools and intelligence platforms.

A pragmatic mapping playbook

For most OEMs and EMS firms, the fastest path is a staged mapping program, built out from the parts that matter most:

Step

What to map first

Why

Start with the top 25 revenue-critical parts

Highest revenue-at-risk and line-stop potential

Generates immediate resilience value

Add package and manufacturer site

Package scarcity often breaks alternates

Distinguishes true from paper dual-source

Add fab, OSAT, substrate or leadframe where known

Reveals shared chokepoints

Exposes hidden concentration

Add compliance and origin data

Trade and forced-labor risk often attaches below Tier-1

Prevents “sourced but not shippable” mistakes

Add firmware/toolchain coupling

Electronics failures often arise after physical substitution

Converts sourcing decisions into buildable decisions

Refresh monthly, and on every PCN/EOL

Static maps decay fast

Maintains decision usefulness

Minimum viable visibility

An electronics organization should not wait for the full graph to be complete before acting. A minimum-viable visibility checklist for the top-risk BOMs is sufficient to materially improve decision-making.

Must-have field

Why it matters

MPN and exact package code

Alternates often fail at package level

Approved manufacturer and approved vendor lists

Prevents master-data drift and unauthorized buys

Lifecycle state and last PCN/EOL event

Gives early redesign or LTB window

Known fab/node and OSAT/package path

Reveals upstream concentration

Compliance declarations

Prevents blocked shipments or requalification surprises

Authorized distribution coverage

Lowers counterfeit and broker exposure

Alternate part and qualification status

Separates theoretical from usable resilience

Firmware/toolchain dependency

Catches “software-broken” substitutions

NCNR and open backlog

Quantifies commercial exposure

Revenue and customer exposure

Enables prioritization

This level of product record control matters because BOM, PLM, and part-risk tools all depend on the same approved-source, lifecycle, and change-history data.

Real-time data feeds & governance

The most useful live electronics feeds are:

  • PCN and EOL notices

  • Distributor inventory and lead-time signals

  • Supplier commits and push-outs

  • Shipment arrival estimates and lane variance

  • Customs and tariff changes

  • Quality escapes and returns

  • Geopolitical and weather alerts

  • Internal consumption burn

External market feeds are most valuable when tied to a governed master data model instead of pulled into spreadsheets ad hoc. IPC’s sentiment reports and ECIA’s Industry Pulse show the direction, but they publish monthly or quarterly. On top-risk parts, lead times, allocation status, and distributor stock can shift within weeks, so monthly manual updates are too slow, and the distributor and risk-platform APIs carry the live signal.

A good governance model treats every new signal as one of four classes: authoritative, market intelligence, supplier assertion, or internal observation. Policy or engineering decisions should require at least one authoritative source for legal/compliance changes and at least two independent sources for scarcity claims. That prevents common failure modes such as believing a supplier’s optimism after a capacity event or overreacting to a one-off broker quote.

The digital thread

The desired digital thread connects PLM, ERP, MES, quality, and SCRM, with each system owning one part of the record:

  • PLM — form/fit/function, approved alternates, and ECOs

  • ERP — purchase orders (POs), NCNR, and vendor and financial exposure

  • MES — lot and build traceability

  • Quality — nonconformance reports (NCRs), returns, and qualification evidence

  • SCRM — external lifecycle, supply, geopolitical, compliance, and sub-tier mapping intelligence

At an EMS, where the AML belongs to the OEM customer, an alternate becomes usable only after a customer deviation or AML change, so the thread must reach the customer’s approval step. If AML/AVL, lifecycle, and change control are scattered across disconnected systems, resilience will remain manual and slow.

In a tariff-frontload period, distributor demand, inventory, and lead-time indices can spike due to pulled-forward orders and appear to be a structural chokepoint even when underlying capacity is fine, while supplier statements can understate the real tightness. Cross-validated data is what makes visibility useful.

Resilience strategies & design tradeoffs

There is no single best resilience strategy in electronics, because the right lever depends on the failure mode. Temporary logistics noise often yields to inventory and rerouting. A package or OSAT chokepoint rarely yields to rerouting; it clears through a package-qualified alternate, a redesign, the supplier qualifying a second assembly site, or contracted allocation, with inventory bridging the wait if it can be secured. And where trade policy is the constraint, geographic duality and customs engineering often matter more than extra stock.

US customs generally assigns a chip’s origin to the country where its wafer was fabricated, so moving assembly or ship-from alone may not change the duty. The strongest programs combine multi-sourcing, design-for-supply, selective buffering, and contractual reservation rather than betting on one tool.

Single sourcing and regional exposure often sit on the same BOM lines, as the sensor maker Leuze found when it re-evaluated a product built in Asia:

“We identified components that were either unavailable in Europe or restricted to a single source. After the analysis, we found alternatives that were more cost-effective and offered better availability. This allowed us to bring production back to Germany.”

— Dimitri Skoric, Project Procurement, Leuze

Resilience strategy decision matrix

Strategy

Best used when

Trade-off

Electronics realism test

True dual-source

Electrical and package compatibility can be qualified

Upside: strongest continuity
Downside: qualification cost, engineering overhead

Must prove distinct package/site path, not just two logos

Buffer stock

Risk is time-bounded or lane-sensitive

Upside: fastest to execute, while supply is still buyable and, at an EMS, once the customer authorizes the liability
Downside: working capital, obsolescence, NCNR mismatch

Avoid buffering fast-obsolescence parts without lifecycle confidence

Last-time-buy

EOL is known and redesign is slow

Upside: buys time for installed base or certification-heavy products
Downside: demand forecast error, dead stock risk

Needs verified LTB window and storage controls

Regional duality

Trade or geopolitical risk dominates

Upside: lowers policy and lane risk
Downside: higher cost, qualification effort

Works only if data and quality processes are mirrored

Design-for-supply

New product or mid-life redesign

Upside: structural reduction in single-point failure risk
Downside: upfront design tradeoffs

Must include package, firmware, and test implications

Capacity reservation or LTA

Chokepoint is known and strategic

Upside: improves priority and predictability
Downside: take-or-pay or NCNR liability, and locked prices if the market falls

Effective only if forecasts are credible

Vendor-managed inventory (VMI) or consignment

Demand is stable and supplier relationship is strong

Upside: reduces stockout risk at use point
Downside: less effective in strict allocation

Needs clear title, liability, and obsolescence terms

Design-for-supply checklist

Electronics resilience is won early in the design process, which is why resilience for OEMs starts at the design stage. The most useful checklist is:

Design question

Why it matters

Can the footprint accept more than one package or vendor family?

Avoids package-only lock-in

Is there a pin-compatible or near-pin-compatible alternate?

Reduces redesign scope

If not, can a mezzanine, daughtercard, or modular boundary isolate the risky part?

Contains future redesign cost

Is firmware abstracted from device-specific peripherals and timing assumptions?

Makes substitutions real, not cosmetic

Are there programmable substitutes for logic or control functions?

Adds options where exact alternates are scarce, with its own allocation and toolchain exposure

Is performance over-specified beyond real need?

Wider spec windows increase alternate pool

Are passives selected from dense, multi-supplier commodity families where possible?

Improves AML depth

Are critical components placed to allow rework or package migration?

Lowers ECO and service burden

Texas Instruments’ second-sourcing guidance and AMD’s package-footprint compatibility documentation both show why this matters: whether an alternate is feasible is often decided by PCB layout and package planning, long before procurement is involved.

📊 See which products an EOL puts at risk

Flag lifecycle, availability, and compliance risk on every BOM, and see which assemblies each part affects.

👉 Explore Risk (SCRM)

Buffer stock policy

A defensible buffer policy should distinguish base stock from shortage-mode stock. Use the normal variability model for baseline coverage, then apply a risk multiplier only to the small set of parts with high concentration, high revenue exposure, or long requalification time. A practical policy looks like this:

  • Base safety stock — set by demand and lead-time variability.

  • Shortage-mode uplift — added when leading indicators (lead-time slope, commit slippage, distributor depletion) or a policy shock cross a threshold, before formal allocation. Once allocation is declared, extra volume usually can’t be bought, and over-ordering is treated as phantom demand. PCN and EOL exposure goes through the LTB decision, not safety stock.

  • Lifecycle cap — no excess buys on parts with an unstable lifecycle or a likely redesign, and no more than date-code acceptance windows, moisture-sensitivity storage limits, and solderability aging allow.

  • Quarterly burn-down review — excess stock released against demand and roadmap updates.

This avoids the common mistake of treating all parts as shortage parts, which usually turns resilience into dead inventory. At an EMS, any buffer or uplift above customer demand also requires written customer authorization covering excess, obsolescence, and NCNR liability; otherwise, the EMS carries the stock.

Contracting levers that matter

For constrained categories, contracting levers deserve equal weight to sourcing tactics, and they must be reflected in the OEM–EMS agreement: when the EMS buys turnkey, every NCNR commitment, last-time buy, or shortage buffer placed on the OEM’s forecast becomes an excess-and-obsolete liability unless the contract specifies who owns it.

In 2026, the most relevant levers are:

  • LTAs with explicit volume bands

  • NCNR clauses linked to forecast validity windows

  • Capacity reservations for package and test or strategic materials

  • VMI or consignment for stable-demand lines

  • Priority or escalation language tied to collaboration and commit behavior

Buyers negotiating any of the above are competing against commitments that already extend years ahead: in the tightest memory categories, non-cancelable volume is booked well beyond the usual planning horizon, and some supply agreements already run through the end of the decade. Supplier emphasis on specific commitments and multiyear discussions, combined with allocation in memory, shows that “purchase order only” operating models are too weak for the most constrained categories.

Passives show the same selective pressure. In August 2026, TrendForce reported MLCC lead times diverging: standard parts held at 14–18 weeks, while some high-end parts stretched to around 40 weeks. Teams with parametric-approved alternates and spec flexibility can absorb that kind of selective pressure; teams with frozen, over-tight specs cannot.

Risk scoring, KPIs, dashboards & escalation

The most useful electronics score is a stacked score reflecting four layers: category risk, supplier risk, part risk, and policy/geography risk. That structure matches what SCRM platforms do in different ways and aligns with the semiconductor resilience literature: risk emerges from the network, not from an isolated vendor record.

Sample scoring model

A practical 100-point model is:

  • Category risk (25 points) — market tightness, lead-time trend, and allocation prevalence

  • Supplier risk (25 points) — quality, financial health, on-time performance, and cyber and compliance posture

  • Part risk (30 points) — lifecycle state, package uniqueness, alternate readiness, and firmware or qualification dependency

  • Geopolitical and regulatory risk (20 points) — tariff and export-control exposure, forced-labor and declaration risk, and lane sensitivity

Within part risk, the most predictive electronics fields tend to be lifecycle notice quality, package uniqueness, and qualified-alternate depth. Within category risk, the most predictive fields are lead-time slope and allocation flags.

The category emphasis matches recent allocation in memory and packaging; the part-level emphasis comes from EOL and package-migration events. The weights below map to the four layers (category 25, supplier 25, part 30, geopolitical and regulatory 20). Treat them as a starting point and back-test them against your own shortage and EOL history.

Example part scorecard

Dimension

Weight

Example metric

Threshold concern

Lead-time slope

13

Change in supplier-confirmed lead time over 30 days, in %

>20% increase in 30 days

Allocation status

12

Binary or graded

Any allocation on top-25 revenue part

Lifecycle risk

10

Active/NRND/EOL / no-PCN EOL trend

NRND or recent EOL family

Alternate readiness

8

Qualified alternates count

No qualified alternate for a commodity part, or no mitigation plan for a sole-source part

Package uniqueness

6

Unique footprint/package family

Sole package path

Compliance exposure

8

Missing/aging declarations

Any gap on ship-critical part

Authorized coverage

6

Authorized stock path available

Broker-only path

Supplier operational health

25

OTIF, quality escapes, commit misses

Two-period deterioration

Geopolitical/trade exposure

12

Tariff/export-control/lane concentration

Any controlled or repriced flow

Scores of 0–29 mean monitor, 30–49 buyer action, 50–69 cross-functional review, and 70+ executive review and response plan. To decide which parts to work on first, weigh each score by exposure, meaning how many assemblies a part can stop and how much revenue they carry. A part that scores 60 and can stop ten assemblies comes before one that scores 70 and stops one.

Our OEM procurement playbook applies the same ranking to sourcing decisions. These cutoffs are organizational choices, but the structure holds up because it ties score movement to observable signals.

KPI set with owners & failure modes

The table below turns the scoring model into operating metrics.

KPI

Formula

Owner & cadence

Where it misleads

Lead-time slope
Speed of deterioration

(LT current – LT 30d ago) / LT 30d ago

Commodity manager · weekly

Supplier stops publishing or masks with “TBD”

Commit volatility
Instability in confirmations

Std. dev. of weekly commits / mean commit

Supply planning · weekly

Looks stable when demand already rationed

Allocation flag rate
Share of critical parts under allocation

Allocated critical parts / total critical parts

Procurement · weekly

Informal allocation not formally declared

PCN velocity
Rate of product/process changes

PCNs per 1,000 active MPNs

Engineering quality · monthly

Low count can hide missing notices

EOL coverage gap
EOL events without qualified alternate

EOL parts without alternate / total EOL parts

Engineering · monthly

Alternate exists on paper but not qualified

AML depth
Resilience of approved supply base

Qualified sources per critical part

Component engineering · monthly

Shared sub-tier makes depth look better than reality

NCNR at risk
Commercial exposure to obsolete or repriced stock

NCNR value on at-risk parts

Procurement finance · monthly

Excludes future liability in backlog

Broker dependency ratio
Authenticity risk under shortage

Broker spend / total acute-buy spend

Procurement quality · weekly

Independent-distributor stock tagged as authorized, or franchised excess-inventory programs counted as broker spend

OTIF drift
Operating deterioration

OTIF current – OTIF trailing quarter

Supplier management · monthly

Temporary expedite masks systemic miss

Expedite premium
Cost of reactive posture

Expedite/logistics premium as % of material cost

Operations finance · monthly

Normalized cost can hide service damage

Revenue at risk
Commercial impact if part fails

Revenue tied to open demand of at-risk part

Sales and operations planning (S&OP) / finance · weekly

Assumes no substitution or customer reprioritization

These KPIs are useful because they split leading indicators from lagging indicators. Lead-time slope and PCN velocity provide early warning, but quoted lead times are inflated by double-ordering, and allocation flags usually appear only after a shortage has already started, so pair them with distributor inventory weeks and book-to-bill. OTIF drift and expedite premium tell you what already went wrong.

Dashboard views that matter

The most decision-useful dashboards in electronics are usually these four:

Dashboard

Purpose

Top 25 at-risk parts

Prioritizes scarce management attention

Single points of failure

Shows parts with low AML depth and shared sub-tier dependence

Revenue at risk

Translates supply risk into business language

NCNR and buffer exposure

Prevents “resilience” from becoming stranded inventory

Part-intelligence and SCRM graph platforms all market variations of these views, because they correspond to real decision moments in electronics programs.

Escalation policy

Level

Trigger

Response

Executive cadence

Buyer action

Score 30–49 or mild KPI movement

Buyer-led watchlist and alternate check

Monthly

Managed exception

Score 50–69, allocation on non-top part, or PCN with moderate design impact

Cross-functional review with engineering and quality

Biweekly

War-room

Score 70+, a top-25 part on allocation, no alternate with a confirmed gap, or a trade disruption

Daily action tracker; supplier escalation; customer impact analysis

Twice weekly

Executive crisis

Imminent line stop, major revenue-at-risk, export-control block, or counterfeit suspicion on critical build

Executive sponsor, legal/compliance review, scenario decisions

Daily

The most common escalation failure is threshold inflation: teams wait for hard line-stop evidence before escalating. In electronics, by the time the line is at risk, the qualifying actions may already be too late.

The pattern of discontinuations arriving without formal notice shows why a lagging dashboard fails. If many EOL events arrive without normal notice, the program must proactively monitor alternate coverage and lifecycle forecasts, not just incoming PCN inboxes. Our PCBA obsolescence checklist is a quick way to see where a program stands.

Response playbooks, tooling & operating model

Response playbooks work only when decision gates are explicit. Electronics teams frequently know what can be done but lose time deciding who can authorize what. The four scenarios below should therefore be pre-approved with owners, along with evidence requirements and stop/go gates.

Scenario playbooks & decision gates

1. Shortage and allocation

  • First 24 hours — confirm exact part/package/site; freeze demand assumptions; verify authorized stock

  • 24–72 hours — supplier escalation; screen alternates; assess broker need under anti-counterfeit controls (at an EMS, a broker buy and its price premium also need the OEM customer’s written approval before the PO is placed)

  • 3–10 days — reallocate demand, execute expedites selectively, customer communication

  • Decision gate — ship with existing source, switch to alternate (at an EMS, only with the OEM customer’s approved deviation or AML update), or ration demand across programs and customers

2. PCN

  • First 24 hours — classify change type and affected assemblies; open impact case

  • 24–72 hours — engineering impact analysis, supplier Q&A, qualification plan

  • 3–10 days — secure bridge stock of pre-change material; start qualification builds and reliability testing, which often take weeks to months for fab, die, or assembly-site changes; get customer approval where the OEM owns the AML; approve the ECO and update AML/AVL when qualification closes

  • Decision gate — accept as-is; request samples, an extension, or a last-time buy of pre-change material; or move to a qualified alternate path

3. EOL

  • First 24 hours — verify LTB window, remaining stock, installed-base demand

  • 24–72 hours — size installed-base and service demand; open the lifetime-buy versus redesign analysis with a decision date set well inside the LTB window

  • 3–10 days — model storage, attrition, and service burden; prepare the LTB quantity (at an EMS, with the OEM customer’s written liability authorization for the NCNR buy) or redesign milestone plan for approval

  • Decision gate — lTB, redesign, replace product, or service strategy change

4. Geopolitical/trade disruption

  • First 24 hours — classify legal exposure; stop non-compliant flows

  • 24–72 hours — reroute lanes, re-cost BOM, verify customs and license path

  • 3–10 days — regional re-source, customer promise-date reset, contract invocation

  • Decision gate — continue flow, pause flow, or shift geography

JEDEC change/discontinuance standards, Microchip’s PCN/EOL policy, supply chain risk guidance from the Cybersecurity and Infrastructure Security Agency (CISA) and BIS, and counterfeiting controls under the Defense Federal Acquisition Regulation Supplement (DFARS) and the Defense Logistics Agency (DLA) all support the sequence above: classify first, contain second, decide with evidence third.

Lean RACI matrix for crisis response

In the table, A = accountable, R = responsible, C = consulted, and I = informed. The executive sponsor (C*) is consulted by default and approves at the war-room and executive-crisis levels, on major ECO costs, on last-time buy and redesign funding, and on any decision to pause flow or shift geography.

Role

Shortage

PCN

EOL

Geopolitical

Commodity management

A/R

C

R

C

Component engineering

C

A/R

A/R

C

Quality and reliability

C

R

C

C

Compliance and legal

C

C

I

A/R

Operations/planning

R

C

C

R

Finance

C

I

C

R

Executive sponsor

C*

C*

C*

C*

Supply risk briefing

Escalations move faster when every brief has the same shape: what changed, which parts and assemblies are affected and what revenue is exposed, the evidence (a supplier statement, an independent market signal, and your own demand and backlog), two or three options, a recommendation, a decision deadline, and a named owner.

⚡ Run OEM procurement from one live BOM

Source, quote, and track supplier and part risk for every product in one platform.

👉 See the OEM platform

Software & tooling

Electronics teams should separate generic SCRM from electronics-native product continuity. The second category matters because BOM-level lifecycle and package intelligence are where many actual line-stop risks originate. The market for SCRM software is broad, but the useful categories for electronics are fairly clear.

Generic supplier-risk platforms

Enterprise supplier-risk platforms are built around automated assessment, exposure calculation, issue-management workflows, and incident monitoring, scored across operational, financial, compliance, cyber, sustainability, and geopolitical dimensions.

They are strongest when the problem is enterprise-level supplier exposure and workflow orchestration across every category a company buys. They are weakest at the part level, which, in electronics, is where the line-stop risk lies: a supplier score that isn’t connected to the BOM will not tell you that a single package has only one qualified source.

ERP & procurement backbone

The ERP and procurement backbone matters because it is where supplier masters, purchase orders, contracts, receipts, planning data, and exception workflows live. An SCRM program that cannot read that data stays observational rather than operational. For most companies, the ERP layer is where risk decisions become spend decisions.

Electronics intelligence layer

This is the most underappreciated piece of the stack. Part-intelligence tools are built around BOM automation, electronic-parts databases, and lifecycle risk analysis, which connect SCRM to engineering reality: approved manufacturer parts, alternates, lifecycle status, compliance flags, and BOM-level exposure. A company without reliable part intelligence can still build decent supplier-risk dashboards, but it will struggle to answer the harder question: “Which exact assemblies fail if this part, package, PCN, or EOL event moves against us?”

Control-tower & monitoring capability

The Defense Business Board’s January 2025 supply chain illumination report points toward a modular stack with digital BOMs, selective near-real-time monitoring, and advanced analytics. This category includes shipment tracking, event monitoring, control-tower logic, risk propagation, and decision support.

The key design rule here is selectivity. The DBB explicitly argues for focusing near-real-time visibility on critical risk areas. In electronics, that usually means line-critical semiconductors, constrained passives, regionally exposed logistics lanes, and policy-driven exceptions rather than blanket monitoring of the entire catalog.

What to look for in SCRM software

The best software evaluation criteria for electronics are capability tests, starting with whether the tool supports multi-tier mapping and links suppliers to part numbers and part numbers to product BOMs. Here is a quick guide:

Capability

Why it matters in electronics

Minimum proof in demo

BOM ingestion at MPN/package level

Risk sits below supplier name

Live upload with package-aware rollup

PCN/EOL automation

Lifecycle change is continuous

Show notice ingestion, dedupe, assignment, closure

Multi-tier graph with part-to-site mapping

Shared chokepoints hide sub-tier

Show one part mapped to fab/OSAT/site or raw-material node

Parametric alternates and form-fit-function logic

Alternates must be technically usable

Show graded alternates and qualification status

Distributor and inventory integration

Market speed matters

Show authorized-stock and lead-time overlay

Compliance and trade content

Part may be buyable but not shippable

Show RoHS, REACH, forced-labor, and export checks on a BOM

ERP/PLM/MES integration

Decisions fail without master-data sync

Show how an approved AML/AVL or lifecycle change reaches your PLM/ERP

Audit trail and workflow

Crisis decisions must be reviewable

Show owner, timestamp, rationale, closeout

Explainability

Black-box scores undermine action

Show score decomposition by part

Security and retention

BOMs and supplier graphs are sensitive

Show role-based access and retention controls

Electronics-native platforms cluster around these capabilities in different ways. Some center BOM and lifecycle risk, some emphasize multi-tier part-to-site mapping, some graph scoring across risk domains, and some connect design-stage BOM decisions to market signals. SiliconExpert and Accuris, two of the part-data sources Luminovo connects to, center BOM, approved-manufacturer, and lifecycle control. Luminovo’s Risk (SCRM) works at the BOM level described above: lifecycle, availability, and compliance flags on the parts in a live product.

Test vendors on your own BOM

In a demo, ask each vendor to work on one of your live BOMs with at least 500 MPNs: flag PCN, EOL, and compliance issues, rank the top ten parts by continuity risk, and explain why each proposed alternate is or isn’t suitable. Then have them trace one critical part through its supplier, site, and sub-tier exposure. Expect the sub-tier view to stop where manufacturers stop disclosing, and ask which data source and license tier each flag comes from, especially PCNs.

Target operating model & roadmap

Time frame

What to implement

First 30 days

Stand up top-25 part watchlist; define scorecard; assign owners; begin weekly risk review

By 60 days

Visibility on top-25 parts, PCN and EOL monitoring on, shortage and PCN playbooks live

By 90 days

Add revenue-at-risk and NCNR dashboards; pilot alternate qualification workflow; formalize executive escalation

By 12 months

Mapping to top-100 parts and key sub-tier sites, SCRM linked to PLM and ERP, design-for-supply in product launch gates, quarterly playbook audits

Training should focus less on tool usage and more on decision rights: who can approve broker buys, who can approve NCNR commitments, who owns alternate qualification timing, who decides customer reprioritization, and who signs off on geopolitical holds. That is where many otherwise capable programs still fail.

Fix the data before buying tools

Software does not create resilience on its own. The Defense Business Board’s findings repeatedly point to mapped critical supply chains, digital BOMs, modular technology stacks, and well-governed data.

In electronics, SCRM tools are most effective when master data, engineering change governance, approved source lists, lifecycle monitoring, and trade or compliance attributes are already governed well enough to trust. When those foundations are weak, new tools often become expensive ways to display the same ambiguity faster.

Glossary

  • ABF (Ajinomoto build-up film): The insulating material used in the build-up layers of advanced chip substrates.

  • Allocation: A supplier rationing constrained output across customers, whether by contract, by strategic preference, or through distribution.

  • AML/AVL (approved manufacturer list and approved vendor list): The controlled lists of which manufacturer part numbers are approved for an internal part and which sources may supply them. At an EMS, the OEM customer usually controls the AML, while source selection often stays with the EMS within the customer’s authorized-channel rules.

  • CoWoS (chip-on-wafer-on-substrate): TSMC’s 2.5D advanced packaging technology, used to pair AI accelerators with high-bandwidth memory.

  • EMS/ODM (electronics manufacturing services provider and original design manufacturer): Companies that build products for OEMs, and in the ODM’s case also design them.

  • EOL/NRND (end of life and not recommended for new designs): Lifecycle states that signal a part is being discontinued or should stay out of new designs.

  • HBM (high-bandwidth memory): Stacked DRAM packaged next to AI accelerators.

  • Lead-time slope: The percentage change in supplier-confirmed lead time over a set period, usually 30 days; an early-warning signal for shortages.

  • LTA (long-term agreement): A multi-period supply contract with volume bands, pricing, and priority terms, often in exchange for volume commitments that range from rolling forecasts to take-or-pay.

  • LTB (last-time buy): The final order, usually NCNR, that a customer can place before a part is discontinued, sized to cover remaining production and service demand.

  • MPN (manufacturer part number): The manufacturer’s identifier for a part, whose full orderable form also encodes package, packaging, and grade.

  • NCNR (non-cancelable, non-returnable): A purchase condition common for long-lead, allocated, or special-order parts.

  • OCM (original component manufacturer): The company whose name and part number the component carries, and which controls its authorized sales channel.

  • OEM (original equipment manufacturer): The company that owns and sells the finished product, and usually controls its AML.

  • OSAT (outsourced semiconductor assembly and test): The providers that package and test chips after wafer fabrication.

  • OTIF (on-time in-full): The share of order lines delivered in full within an agreed window of a fixed baseline date, such as the customer request date.

  • PCN/PDN (product change notification and product discontinuance notice): The formal manufacturer notices for part changes and discontinuations, set out in J-STD-046 and J-STD-048.

  • PLM/ERP/MES (product lifecycle management, enterprise resource planning, and manufacturing execution system): The systems that hold the product record, the commercial and planning data, and the build record.

  • RACI (responsible, accountable, consulted, informed): A matrix that assigns decision rights for each response scenario.

  • SCRM (supply chain risk management): Identifying where supply can fail, how likely and how damaging each failure would be, what to do about it, and how fast the organization detects and responds.

  • SRM (supplier relationship management): How a company segments, measures, and develops its suppliers, producing the performance data that sourcing and risk decisions draw on.

  • Tier-1/sub-tier: Tier-1 suppliers sell to you directly; sub-tier suppliers (Tier-2, Tier-3), such as fabs, OSATs, and substrate makers, sit behind them. When you buy through distribution, the distributor is your commercial Tier-1, but the OCM still sets allocation, lifecycle status, and change notices.

  • VMI/consignment (vendor-managed inventory and consignment): Inventory models in which the supplier manages replenishment or retains title until the parts are used. Neither removes the buyer’s liability for excess or obsolete stock; the contract only shifts when and how much of it applies.

Catch EOL risk by assembly

Flag NRND and EOL parts on every BOM and see which assemblies need an alternate before the last-time buy closes.

  • Pepperl+Fuchs logo
  • Leuze logo
  • GarnerOsborne logo
  • Cicor logo
  • Connect Group logo
  • TQ logo
  • BMK logo
  • Asteelflash logo
  • Zollner Elektronik logo
  • SICK logo
  • Liebherr logo

Catch EOL risk by assembly

Flag NRND and EOL parts on every BOM and see which assemblies need an alternate before the last-time buy closes.

  • Pepperl+Fuchs logo
  • Leuze logo
  • GarnerOsborne logo
  • Cicor logo
  • Connect Group logo
  • TQ logo
  • BMK logo
  • Asteelflash logo
  • Zollner Elektronik logo
  • SICK logo
  • Liebherr logo

Catch EOL risk by assembly

Flag NRND and EOL parts on every BOM and see which assemblies need an alternate before the last-time buy closes.

  • Pepperl+Fuchs logo
  • Leuze logo
  • GarnerOsborne logo
  • Cicor logo
  • Connect Group logo
  • TQ logo
  • BMK logo
  • Asteelflash logo
  • Zollner Elektronik logo
  • SICK logo
  • Liebherr logo

Frequently asked questions

What is supply chain risk management in electronics?

Supply chain risk management in electronics is the capability to identify where component supply can fail, measure the operational and financial damage, prioritize mitigation, and shorten the time between a change in market conditions and a decision. It covers suppliers, components, manufacturing, logistics, and compliance. What makes it specific to electronics is that it has to reach below Tier-1, down to the fab, packaging, and substrate dependencies a bill of materials (BOM) inherits without ever naming them.

Why are electronics supply chains more fragile than those in other industries?

Electronics supply chains carry four structural weaknesses at once: extreme specialization, deep multi-tier opacity, fast component obsolescence, and a small number of hard bottlenecks at the wafer, advanced packaging, test, substrate, and critical-material levels. One disruption at a single chokepoint can stop several unrelated products, since approved manufacturers that look independent on paper often share the same upstream fab or outsourced semiconductor assembly and test (OSAT) provider.

How can companies improve multi-tier supply chain visibility?

Multi-tier visibility improves most when mapping starts at the part and extends to the site, rather than stopping at the supplier name. Map the top revenue-critical parts through manufacturer, fab, packaging provider, substrate supplier, compliance source, and logistics lane, then refresh on every product change notification (PCN) and end-of-life (EOL) event. Manually maintained maps go stale fast. Solutions like Luminovo’s Risk (SCRM) keep the part-level layer (lifecycle, compliance, and availability) up to date with connected part-data sources and tied to every assembly that uses each part, while fab, packaging, and substrate mapping still depend on supplier disclosure.

What are the four core pillars of supply chain risk management in electronics?

The four core pillars of supply chain risk management in electronics are visibility, risk scoring, governance, and response playbooks, and the order matters. Visibility establishes what the product actually depends on, scoring ranks exposure so attention goes to the parts that can stop a line, governance settles who decides what and by when, and playbooks turn a decision into an executed action. Continuous monitoring runs underneath all four, keeping supply, lifecycle, and policy data current enough to be trusted.

What are the main types of supply chain risk in electronics manufacturing?

Electronics supply chain risk falls into seven families: demand risk, supply risk, geopolitical risk, regulatory and compliance risk, operational risk, lifecycle risk, and authenticity and quality risk. What separates electronics from other industries is where each one tends to surface. Supply risk usually originates at Tier-2 and Tier-3, in fabs, packaging, and substrates. Geopolitical risk can start there too, but it often bites at Tier-1 and at your own border, through tariffs, classification, and licensing. Lifecycle risk, meaning product change notifications (PCNs), end-of-life (EOL) notices, and package changes, lands directly on the bill of materials (BOM) and can turn a sourcing problem into a redesign.

Why does component lifecycle management matter for supply chain risk?

Component lifecycle management matters because discontinuations and package changes turn a sourcing problem into an engineering problem. An end-of-life (EOL) notice can trigger a redesign, requalification, a lifetime buy, and a years-of-service obligation. Many EOL events now arrive with no formal manufacturer notice, so programs that wait for notices to land in an inbox find out late. Automated lifecycle monitoring flags the exposure while a redesign window still exists.

Can dual sourcing alone reduce electronics supply chain risk?

Dual sourcing alone only partially reduces electronics supply chain risk. It helps commercially, with two allocation queues and two lifecycle roadmaps, though splitting volume dilutes your share of each supplier’s spend. It protects against capacity and site disruptions only when the two approved sources run on genuinely distinct manufacturing and packaging paths, since two manufacturers can share the same hidden fab, outsourced semiconductor assembly and test (OSAT) provider, or substrate supplier. Usable dual sourcing means a separate part-to-site path and a qualified alternate that engineering has already signed off on.

How should a company respond to a component end-of-life notice?

An end-of-life (EOL) notice triggers a timed decision, so the first step is to verify the last-time-buy window and the remaining authorized stock. Then size the installed base and service demand, compare a lifetime buy against a redesign in terms of cost and schedule, check whether a qualified alternate already exists, and commit to a milestone plan before the buy window closes. The failure mode is deferral: the window shuts while the analysis is still open.

Which KPIs track electronics supply chain risk best?

The most useful key performance indicators (KPIs) split leading signals from lagging ones. The leading indicators are lead-time slope, product change notification (PCN) velocity, and distributor inventory weeks, while allocation flag rate usually confirms a shortage that has already started. End-of-life (EOL) coverage gap and approved manufacturer list depth measure exposure: how badly a disruption will hurt, not whether one is coming. The lagging ones are on-time in-full (OTIF) drift, expedite premium, and broker dependency ratio. Revenue at risk sits across both, and it is the number that turns a component problem into a conversation the business will act on.

What should electronics teams look for in supply chain risk management software?

Electronics teams should test for bill of materials (BOM) intelligence first, since generic supplier-risk dashboards cannot show which assemblies are affected when a part is discontinued, a package changes, or a product change notification (PCN) arrives. The capabilities that matter are BOM ingestion at the manufacturer part number and package levels, PCN and end-of-life (EOL) automation, multi-tier part-to-site mapping, parametric alternates with qualification status, compliance screening, and integration with product lifecycle management (PLM) and enterprise resource planning (ERP) systems. Solutions like Luminovo’s Risk (SCRM) operate at the BOM level, attaching lifecycle, compliance, and availability risk to every assembly that uses each part; PCN monitoring runs through a connected SiliconExpert data feed that includes PCNs, since the base part data doesn’t include them.

More blog articles